Plot
? |
Symb
? |
Source
* |
Average ? |
Thresholds ? |
N_
data |
QC1
parameter |
Data
downloads |
Remarks |
| method |
value |
unit |
method |
value |
| 1 |
• | QC1DB |
NO |
|
micron/WLbin |
none | |
24 |
qc_med_dispers |
this |
last_yr |
all
|
pipeline (YJ prism) |
| 1 |
• | QC1DB |
NO |
|
micron/WLbin |
none | |
24 |
dispersion |
this |
last_yr |
all
|
QCscript (YJ prism) |
| 2 |
• | QC1DB |
NO |
|
micron/WLbin |
none | |
22 |
qc_med_dispers |
this |
last_yr |
all
|
pipeline (YJH prism) |
| 2 |
• | QC1DB |
NO |
|
micron/WLbin |
none | |
22 |
dispersion |
this |
last_yr |
all
|
QCscript (YJH prism) |
| 3 |
• | QC1DB |
NO |
|
micron |
none | |
24 |
qc_min_lambda |
this |
last_yr |
all
|
pipeline (YJ prism) |
| 3 |
• | QC1DB |
NO |
|
micron |
none | |
24 |
lambda0 |
this |
last_yr |
all
|
QCscript (YJ prism) |
| 4 |
• | QC1DB |
NO |
|
micron |
none | |
22 |
qc_min_lambda |
this |
last_yr |
all
|
pipeline (YJH prism) |
| 4 |
• | QC1DB |
NO |
|
micron |
none | |
22 |
lambda0 |
this |
last_yr |
all
|
QCscript (YJH prism) |
| |
|
*Data sources: QC1DB: QC1 database; LOCAL: local data source
|
Plot 1
scores: not implemented
| | data source: | sphere_ifs_wave
(QC1 database) |
dataset:
(numbers below apply to this dataset) | qc_med_dispers | • |
| N_data plotted: | 24 |
| [click plot for closeup] |
Plot 2
scores: not implemented
| | data source: | sphere_ifs_wave
(QC1 database) |
dataset:
(numbers below apply to this dataset) | qc_med_dispers | • |
| N_data plotted: | 22 |
| [click plot for closeup] |
Plot 3
scores: not implemented
| | data source: | sphere_ifs_specpos
(QC1 database) |
dataset:
(numbers below apply to this dataset) | qc_min_lambda | • |
| N_data plotted: | 24 |
| [click plot for closeup] |
Plot 4
scores: not implemented
| | data source: | sphere_ifs_specpos
(QC1 database) |
dataset:
(numbers below apply to this dataset) | qc_min_lambda | • |
| N_data plotted: | 22 |
| [click plot for closeup] |
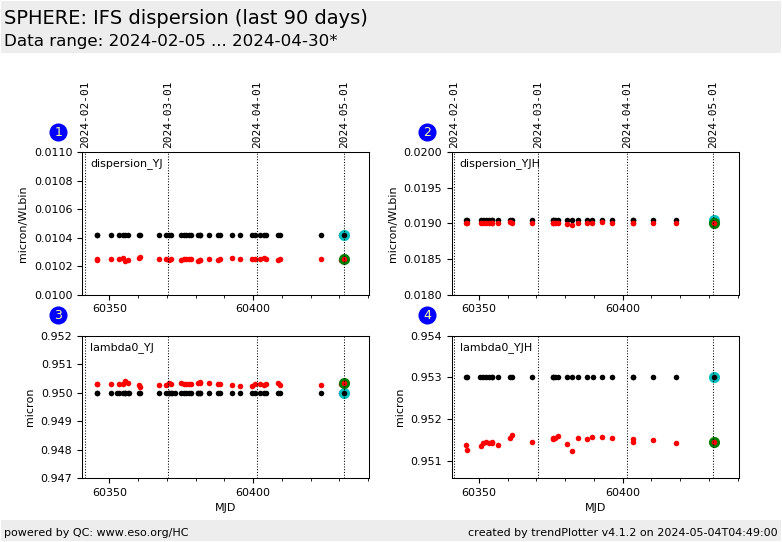
This plot shows the wavelength dispersion as calculated by the QC script.
The dispersion is given in micron / wavelength bin.
The pipeline reports
0.0114 (YJ) and 0.0200 (YJH) in the keyword QC MEDIAN DISPERSION
and
0.01042 (YJ) and 0.01905 (YJH) in the keywords DRS IFS DISPERSON and CD3_3.
The nominal values (out of the User Manual) are
0.0107 (YJ) and 0.0195 (YJH).
The values derived by measuring the arc line positons in the from the pipeline wavelength calibrated cube product are
0.0103 (YJ) and 0.01903 (YJH).
The black points show the values of the static DRS IFS DISPERSON header key.
General information
Click on any of the plots to see a close-up version.
The latest date is indicated on top of the plot.
If configured,
- data points belonging to the latest date are specially marked
- statistical averages are indicated by a solid line, and thresholds by broken lines
- outliers are marked by a red asterisk. They are defined as data points outside the
threshold lines
- "aliens" (= data points outside the plot Y limits) are marked by a red arrow (↑ or ↓)
- you can download the data for each parameter set if the 'Data downloads' link shows up
|
