Plot
? |
Symb
? |
Source
* |
Average ? |
Thresholds ? |
N_
data |
QC1
parameter |
Data
downloads |
Remarks |
| method |
value |
unit |
method |
value |
| 1 |
• | QC1DB |
MEDIAN |
14322.4 |
ADU |
VAL | 1000,25000 |
13 |
qc_adu_left_4 |
this |
last_yr |
all
|
Y-band left beam |
| 2 |
• | QC1DB |
MEDIAN |
17126.4 |
ADU |
VAL | 1000,25000 |
12 |
qc_adu_left_4 |
this |
last_yr |
all
|
J-band left beam |
| 3 |
• | QC1DB |
MEDIAN |
18732.6 |
ADU |
VAL | 1000,25000 |
32 |
qc_adu_left_4 |
this |
last_yr |
all
|
H-band left beam |
| 4 |
• | QC1DB |
MEDIAN |
9461.91 |
ADU |
VAL | 1000,25000 |
12 |
qc_adu_left_4 |
this |
last_yr |
all
|
K-band left beam |
| |
|
*Data sources: QC1DB: QC1 database; LOCAL: local data source
|
Plot 1
scores:  2| 2|
| | data source: | sphere_irdis_flat
(QC1 database) |
| dataset: | qc_adu_left_4 | • |
| median: | 14322.4 | ADU |
| fixed thresholds: | 1000...25000 | ADU |
| N_data plotted: | 13 |
| [click plot for closeup] |
Plot 2
scores: 2|
| | data source: | sphere_irdis_flat
(QC1 database) |
| dataset: | qc_adu_left_4 | • |
| median: | 17126.4 | ADU |
| fixed thresholds: | 1000...25000 | ADU |
| N_data plotted: | 12 |
| [click plot for closeup] |
Plot 3
scores: 3|
| | data source: | sphere_irdis_flat
(QC1 database) |
| dataset: | qc_adu_left_4 | • |
| median: | 18732.6 | ADU |
| fixed thresholds: | 1000...25000 | ADU |
| N_data plotted: | 32 |
| [click plot for closeup] |
Plot 4
scores: 2|
| | data source: | sphere_irdis_flat
(QC1 database) |
| dataset: | qc_adu_left_4 | • |
| median: | 9461.91 | ADU |
| fixed thresholds: | 1000...25000 | ADU |
| N_data plotted: | 12 |
| [click plot for closeup] |
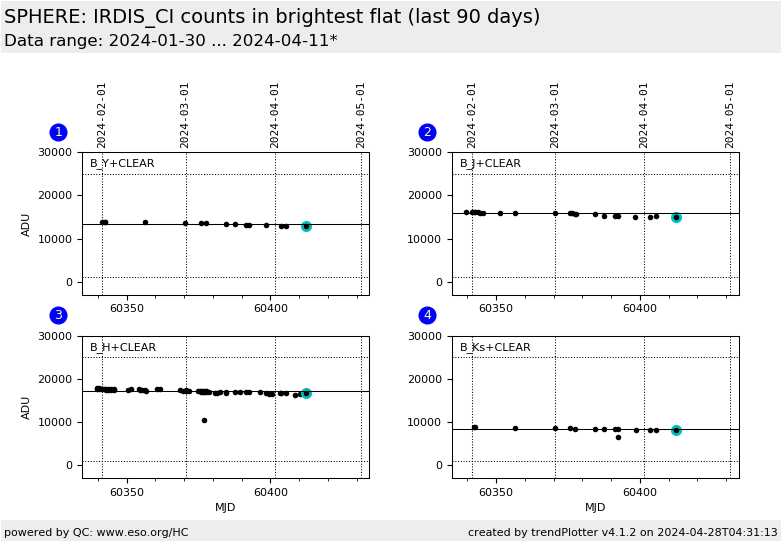
This plot shows the median counts in the brightest of five raw input flats.
The QC parameter is monitored for the left beam
and for the four broad band filters in the common filter wheel: B_Y, B_H, B_J and B_K,
separately. The dual beam filter wheel is 'CLEAR' in classical imaging mode.
The bi-variate distribution in the B_Ks filter values originate from different
templates.
New 2018-10-16: The plot shows the counts in one plane of the raw frame cube corresponding to NDIT=1.
For NDIT=40, the total counts in the brightest raw flat is 40 times the counts of one plane of the raw frame cube.
To achieve a S/N-ratio = 200 in the brightest raw flat, about 1000 ADU (new threshold) must be achieved in a single plane.
The S/N ratio in the final master flat is not checked for.
General information
Click on any of the plots to see a close-up version.
The latest date is indicated on top of the plot.
If configured,
- data points belonging to the latest date are specially marked
- statistical averages are indicated by a solid line, and thresholds by broken lines
- outliers are marked by a red asterisk. They are defined as data points outside the
threshold lines
- "aliens" (= data points outside the plot Y limits) are marked by a red arrow (↑ or ↓)
- you can download the data for each parameter set if the 'Data downloads' link shows up
|
