Plot
? |
Symb
? |
Source
* |
Average ? |
Thresholds ? |
N_
data |
QC1
parameter |
Data
downloads |
Remarks |
| method |
value |
unit |
method |
value |
| 1 |
• | QC1DB |
MEDIAN |
18.668 |
ADU |
VAL | 10,30 |
4 |
qc_median |
this |
last_yr |
all
|
DIT=2, Nondest, YJ |
| 1 |
• | QC1DB |
none |
|
ADU |
VAL | 10,30 |
4 |
qc_median |
this |
last_yr |
all
|
DIT=2, Nondest, YJH |
| 2 |
• | QC1DB |
MEDIAN |
71.2935 |
ADU |
VAL | 60,90 |
4 |
qc_median |
this |
last_yr |
all
|
DIT=8, Nondest, YJ |
| 2 |
• | QC1DB |
none |
|
ADU |
VAL | 60,90 |
4 |
qc_median |
this |
last_yr |
all
|
DIT=8, Nondest, YJH |
| 3 |
• | QC1DB |
MEDIAN |
259.616 |
ADU |
VAL | 200,400 |
4 |
qc_median |
this |
last_yr |
all
|
DIT=30, Nondest, YJ |
| 3 |
• | QC1DB |
none |
|
ADU |
VAL | 200,400 |
4 |
qc_median |
this |
last_yr |
all
|
DIT=30, Nondest, YJH |
| 4 |
• | QC1DB |
none |
|
NONE |
none | |
12 |
qc_median |
this |
last_yr |
all
|
|
| 4 |
• | QC1DB |
none |
|
NONE |
none | |
12 |
qc_median |
this |
last_yr |
all
|
|
| |
|
*Data sources: QC1DB: QC1 database; LOCAL: local data source
|
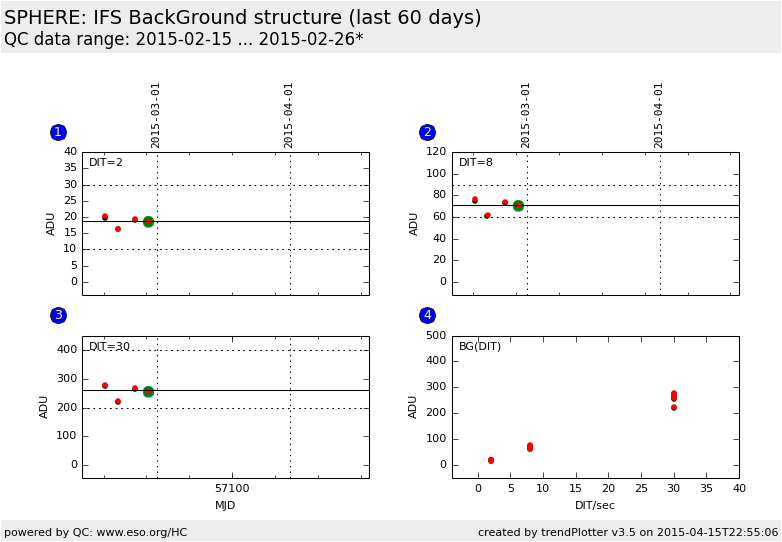
Plot 1
scores: not implemented
| | data source: | sphere_ifs_background
(QC1 database) |
dataset:
(numbers below apply to this dataset) | qc_median | • |
| median: | 18.668 | ADU |
| fixed thresholds: | 10...30 | ADU |
| N_data plotted: | 4 |
| [click on plot for closeup] |
Plot 2
scores: not implemented
| | data source: | sphere_ifs_background
(QC1 database) |
dataset:
(numbers below apply to this dataset) | qc_median | • |
| median: | 71.2935 | ADU |
| fixed thresholds: | 60...90 | ADU |
| N_data plotted: | 4 |
| [click on plot for closeup] |
Plot 3
scores: not implemented
| | data source: | sphere_ifs_background
(QC1 database) |
dataset:
(numbers below apply to this dataset) | qc_median | • |
| median: | 259.616 | ADU |
| fixed thresholds: | 200...400 | ADU |
| N_data plotted: | 4 |
| [click on plot for closeup] |
Plot 4
scores: not implemented
| | data source: | sphere_ifs_background
(QC1 database) |
dataset:
(numbers below apply to this dataset) | qc_median | • |
| average: | none |
| thresholds: | none |
| N_data plotted: | 12 |
| [click on plot for closeup] |
An IFS master dark of the same DIT is associated to the sph_ifs_background recipe,
but configured to be ignored by the recipe. Hence the reported QC parameters cover
the instrumental background radiation plus the electronic dark level of the detector.
See also PIPE-5347 (WH 2015-02)
General information
Click on any of the plots to see a close-up version.
The latest date is indicated on top of the plot.
If configured,
- data points belonging to the latest date are specially marked
- statistical averages are indicated by a solid line, and thresholds by broken lines
- outliers are marked by a red asterisk. They are defined as data points outside the
threshold lines
- "aliens" (= data points outside the plot Y limits) are marked by a red arrow (↑ or ↓)
- you can download the data for each parameter set if the 'Data downloads' link shows up
|

