mirror sites: PL (internal link) HQ     [?]

Health Check monitor


CAL | HC | refs | QC
HealthCheck Monitor
   HOME | UsersGuide
  sl icon ALL INSTRUMENTS
 
all KPI reports
DBI opt.distortion:coeff
Other HC:
QC links:
        [page auto-refreshes after 300 sec]   [stop | on]            [press Ctrl+Shift+R to enforce refresh of scores, dates and news]
SPHERE trending system: HEALTH CHECK report
HELP USERS-GUIDE MORE
Last update: 2015-02-21T08:58:34 (UT)
  | now: 2025-12-19T07:23:49 (UT) muc03 QC pipeline: spher-0.14.0 (installed 2014-12-02)
same group: DIST-X DIST-Y   DIST-X-CORO DIST-Y-CORO
General news: NOTE: The Health Check and calChecker services are moved to qcFlow on an instrument by instrument basis. The current pages will not be updated any longer once the move has been finished.
SPHERE news:  
Report news: 2015-02-03 The IRDIS distortion cannot be monitored. The recipe fails in one of both channels. [whummel@eso.org]
DATE*: [?] 2025-12-12
no data | NLT
2025-12-13
no data | NLT
2025-12-14
no data | NLT
2025-12-15
no data | NLT
2025-12-16
no data | NLT
2025-12-17
no data | NLT
2025-12-18
no data | NLT
r...
Raw CAL displays:
no CAL raw files no CAL raw files no CAL raw files no CAL raw files no CAL raw files no CAL raw files no CAL raw files
P...
CAL product quality:
no CAL products no CAL products no CAL products no CAL products no CAL products no CAL products no CAL products
     

scores&comments | history ... | plot tutorial ... | contact               [?]
*Date on this monitor changes at 21:00 UT
Print: Information and research:
- png file - advanced studies: QC1 browser | QC1 plotter
Plot
?
Symb
?
Source
*
Average ? Thresholds ? N_
data
QC1
parameter
Data
downloads
Remarks
method value unit method value
1 QC1DB MEDIAN   ADU VAL400,600 0 qc_optaxis_x this | last_yr | all Y-band left beam
2 QC1DB MEDIAN   ADU VAL400,600 0 qc_optaxis_x this | last_yr | all Y-band right beam
3 QC1DB MEDIAN   ADU VAL400,600 0 qc_optaxis_x this | last_yr | all J-band left beam
4 QC1DB MEDIAN   ADU VAL400,600 0 qc_optaxis_x this | last_yr | all J-band right beam
5 QC1DB MEDIAN 493.905 ADU VAL400,600 7 qc_optaxis_x this | last_yr | all H-band left beam
6 QC1DB MEDIAN 496.091 ADU VAL400,600 7 qc_optaxis_x this | last_yr | all H-band right beam
7 QC1DB MEDIAN 492.262 ADU VAL400,600 5 qc_optaxis_x this | last_yr | all K-band left beam
8 QC1DB MEDIAN 494.71 ADU VAL400,600 5 qc_optaxis_x this | last_yr | all K-band right beam
*Data sources: QC1DB: QC1 database; LOCAL: local data source
Plot 1
scores: no current data
data source:sphere_irdis_distmap
(QC1 database)
dataset:qc_optaxis_x
median:no dataADU
fixed thresholds:400...600ADU
N_data plotted:0
[click on plot for closeup]
Plot 2
scores: no current data
data source:sphere_irdis_distmap
(QC1 database)
dataset:qc_optaxis_x
median:no dataADU
fixed thresholds:400...600ADU
N_data plotted:0
[click on plot for closeup]
Plot 3
scores: no current data
data source:sphere_irdis_distmap
(QC1 database)
dataset:qc_optaxis_x
median:no dataADU
fixed thresholds:400...600ADU
N_data plotted:0
[click on plot for closeup]
Plot 4
scores: no current data
data source:sphere_irdis_distmap
(QC1 database)
dataset:qc_optaxis_x
median:no dataADU
fixed thresholds:400...600ADU
N_data plotted:0
[click on plot for closeup]
Plot 5
scores: 1|
data source:sphere_irdis_distmap
(QC1 database)
dataset:qc_optaxis_x
median:493.905ADU
fixed thresholds:400...600ADU
N_data plotted:7
[click on plot for closeup]
Plot 6
scores: 1|
data source:sphere_irdis_distmap
(QC1 database)
dataset:qc_optaxis_x
median:496.091ADU
fixed thresholds:400...600ADU
N_data plotted:7
[click on plot for closeup]
Plot 7
scores: 1|
data source:sphere_irdis_distmap
(QC1 database)
dataset:qc_optaxis_x
median:492.262ADU
fixed thresholds:400...600ADU
N_data plotted:5
[click on plot for closeup]
Plot 8
scores: 1|
data source:sphere_irdis_distmap
(QC1 database)
dataset:qc_optaxis_x
median:494.71ADU
fixed thresholds:400...600ADU
N_data plotted:5
[click on plot for closeup]
This plot

2015-02-01: The irdis distortion recipe fails. Either only the left or only the right arm can be processes successfully. This plot shows the rms of the distortion map product. Zero means: the recipe failed.  


General information

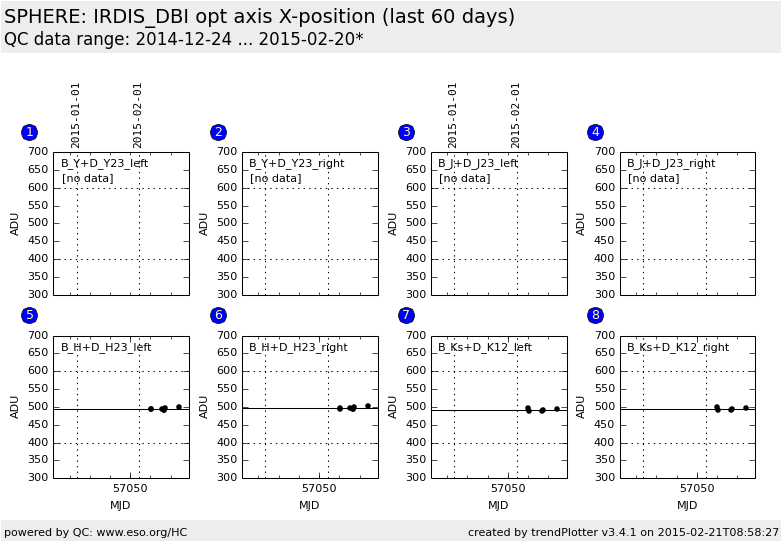
Click on any of the plots to see a close-up version.

The latest date is indicated on top of the plot.

If configured,

  • data points belonging to the latest date are specially marked
  • statistical averages are indicated by a solid line, and thresholds by broken lines
  • outliers are marked by a red asterisk. They are defined as data points outside the threshold lines
  • "aliens" (= data points outside the plot Y limits) are marked by a red arrow ( or )
  • you can download the data for each parameter set if the 'Data downloads' link shows up