SPHERE trending system: HEALTH CHECK report
Last update: 2026-06-12T12:13:04 (UT)
[enable javascript for displaying time difference!]
General news:
NOTE: The Health Check and calChecker services have been moved to qcFlow. These pages are only maintained for comparison
and will be removed in 2026.
SPHERE news:
Note that the current Health Check monitor runs with an incomplete pipeline and an incomplete set of QC1 parameters.
QCG can currently not guarantee completeness and significance at the usual level.
Report news:
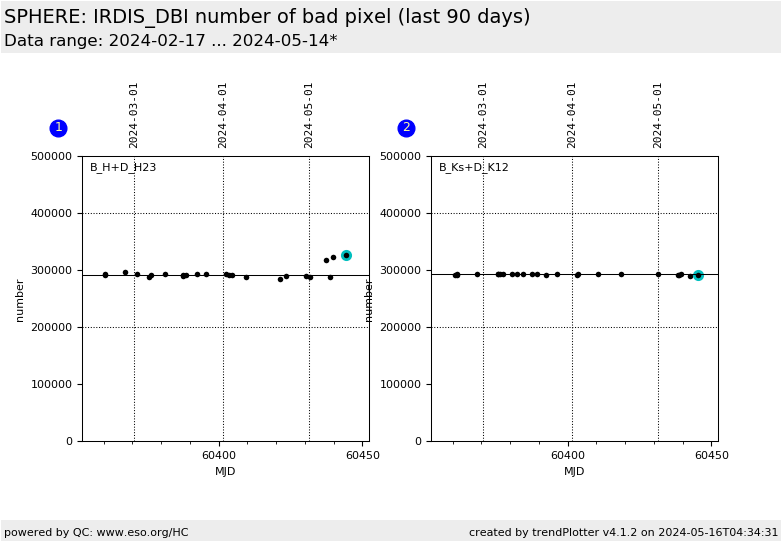
Plot? Symb? Source Average ? Thresholds ? N_ QC1 Data Remarks
method value unit method value
1
• QC1DB MEDIAN 299794 number VAL 200000,400000 23 qc_num_badpix
this |
last_yr |
all
H-band beam
2
• QC1DB MEDIAN 292382 number VAL 200000,400000 21 qc_num_badpix
this |
last_yr |
all
K-band beam
*Data sources: QC1DB: QC1 database; LOCAL: local data source
Plot 1 scores: not implemented
data source: sphere_irdis_flat dataset: qc_num_badpix • median: 299794 number fixed thresholds: 200000...400000 number N_data plotted: 23 [click plot for closeup]
Plot 2 scores: not implemented
data source: sphere_irdis_flat dataset: qc_num_badpix • median: 292382 number fixed thresholds: 200000...400000 number N_data plotted: 21 [click plot for closeup]
This plot
This plots shows the number of bad pixel as derived from the IRDIS flat
recipe for two dual beam filters D_H23 and D_K12.
General information
Click on any of the plots to see a close-up version .
The latest date is indicated on top of the plot.
If configured,
data points belonging to the latest date are specially marked statistical averages are indicated by a solid line, and thresholds by broken lines outliers are marked by a red asterisk. They are defined as data points outside the
threshold lines "aliens" (= data points outside the plot Y limits) are marked by a red arrow (↑ ↓ you can download the data for each parameter set if the 'Data downloads' link shows up
