SPHERE trending system: HEALTH CHECK report
Last update: 2015-10-20T22:55:49 (UT)
[enable javascript for displaying time difference!]
General news:
NOTE: The Health Check and calChecker services are moved to qcFlow on an instrument by instrument basis. The current pages will not be updated any longer once the move has been finished.
SPHERE news:
Note that the current Health Check monitor runs with an incomplete pipeline and an incomplete set of QC1 parameters.
QCG can currently not guarantee completeness and significance at the usual level.
Report news:
Plot? Symb? Source Average ? Thresholds ? N_ QC1 Data Remarks
method value unit method value
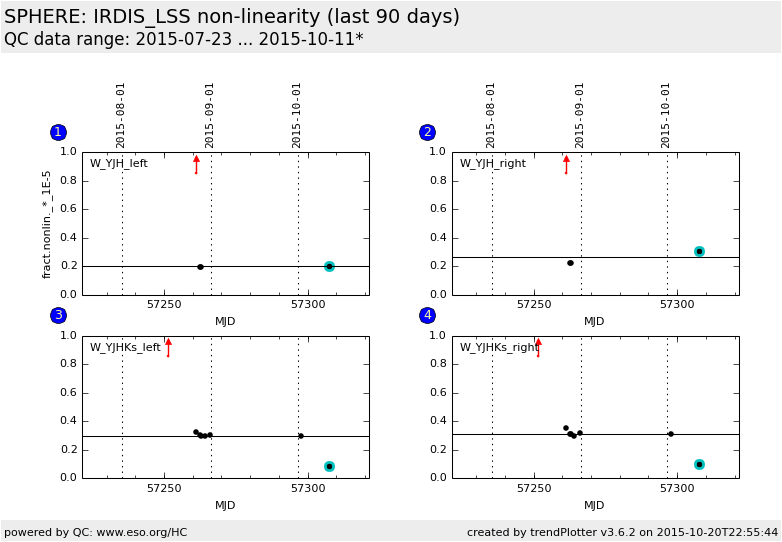
1
• QC1DB MEDIAN 0.198118 fractional_nonlin VAL 0,2 4 qc_flat_nonlin_left
this |
last_yr |
all
H-band left beam
2
• QC1DB MEDIAN 0.266388 fractional_nonlin VAL 0,2 4 qc_flat_nonlin_right
this |
last_yr |
all
H-band right beam
3
• QC1DB MEDIAN 0.297382 fractional_nonlin VAL 0,2 8 qc_flat_nonlin_left
this |
last_yr |
all
K-band left beam
4
• QC1DB MEDIAN 0.312005 fractional_nonlin VAL 0,2 8 qc_flat_nonlin_right
this |
last_yr |
all
K-band right beam
*Data sources: QC1DB: QC1 database; LOCAL: local data source
Plot 1 scores: no current data
data source: sphere_irdis_flat dataset: qc_flat_nonlin_left • median: 0.198118 fractional_nonlin fixed thresholds: 0...2 fractional_nonlin N_data plotted: 4 [click on plot for closeup]
Plot 2 scores: no current data
data source: sphere_irdis_flat dataset: qc_flat_nonlin_right • median: 0.266388 fractional_nonlin fixed thresholds: 0...2 fractional_nonlin N_data plotted: 4 [click on plot for closeup]
Plot 3 scores: no current data
data source: sphere_irdis_flat dataset: qc_flat_nonlin_left • median: 0.297382 fractional_nonlin fixed thresholds: 0...2 fractional_nonlin N_data plotted: 8 [click on plot for closeup]
Plot 4 scores: no current data
data source: sphere_irdis_flat dataset: qc_flat_nonlin_right • median: 0.312005 fractional_nonlin fixed thresholds: 0...2 fractional_nonlin N_data plotted: 8 [click on plot for closeup]
General information
Click on any of the plots to see a close-up version .
The latest date is indicated on top of the plot.
If configured,
data points belonging to the latest date are specially marked statistical averages are indicated by a solid line, and thresholds by broken lines outliers are marked by a red asterisk. They are defined as data points outside the
threshold lines "aliens" (= data points outside the plot Y limits) are marked by a red arrow (↑ ↓ you can download the data for each parameter set if the 'Data downloads' link shows up
