Plot ? |
Symb ? |
Source * |
Average ? |
Thresholds ? |
N_ data |
QC1 parameter |
Data downloads |
Remarks |
method |
value |
unit |
method |
value |
1 |
| QC1DB |
none |
|
ratio |
none | |
6 |
qc_strehl |
this |
last_yr |
all
|
V-band, chip 1, closed loop |
2 |
| QC1DB |
none |
|
ratio |
none | |
6 |
qc_strehl |
this |
last_yr |
all
|
R-band, chip 1, closed loop |
3 |
| QC1DB |
none |
|
ratio |
none | |
6 |
qc_strehl |
this |
last_yr |
all
|
I-band, chip 1, closed loop |
4 |
| QC1DB |
none |
|
ratio |
none | |
6 |
qc_strehl |
this |
last_yr |
all
|
V-band, chip 2, closed loop |
5 |
| QC1DB |
none |
|
ratio |
none | |
6 |
qc_strehl |
this |
last_yr |
all
|
R-band, chip 2, closed loop |
6 |
| QC1DB |
none |
|
ratio |
none | |
6 |
qc_strehl |
this |
last_yr |
all
|
I-band, chip 2, closed loop |
|
*Data sources: QC1DB: QC1 database; LOCAL: local data source
|
Plot 1 scores: not implemented
| data source: | sphere_zimpol_stdpol_pol (QC1 database) |
dataset: | qc_strehl | |
average: | none |
thresholds: | none |
N_data plotted: | 6 |
[click plot for closeup] |
Plot 2 scores: not implemented
| data source: | sphere_zimpol_stdpol_pol (QC1 database) |
dataset: | qc_strehl | |
average: | none |
thresholds: | none |
N_data plotted: | 6 |
[click plot for closeup] |
Plot 3 scores: not implemented
| data source: | sphere_zimpol_stdpol_pol (QC1 database) |
dataset: | qc_strehl | |
average: | none |
thresholds: | none |
N_data plotted: | 6 |
[click plot for closeup] |
Plot 4 scores: not implemented
| data source: | sphere_zimpol_stdpol_pol (QC1 database) |
dataset: | qc_strehl | |
average: | none |
thresholds: | none |
N_data plotted: | 6 |
[click plot for closeup] |
Plot 5 scores: not implemented
| data source: | sphere_zimpol_stdpol_pol (QC1 database) |
dataset: | qc_strehl | |
average: | none |
thresholds: | none |
N_data plotted: | 6 |
[click plot for closeup] |
Plot 6 scores: not implemented
| data source: | sphere_zimpol_stdpol_pol (QC1 database) |
dataset: | qc_strehl | |
average: | none |
thresholds: | none |
N_data plotted: | 6 |
[click plot for closeup] |
This plot
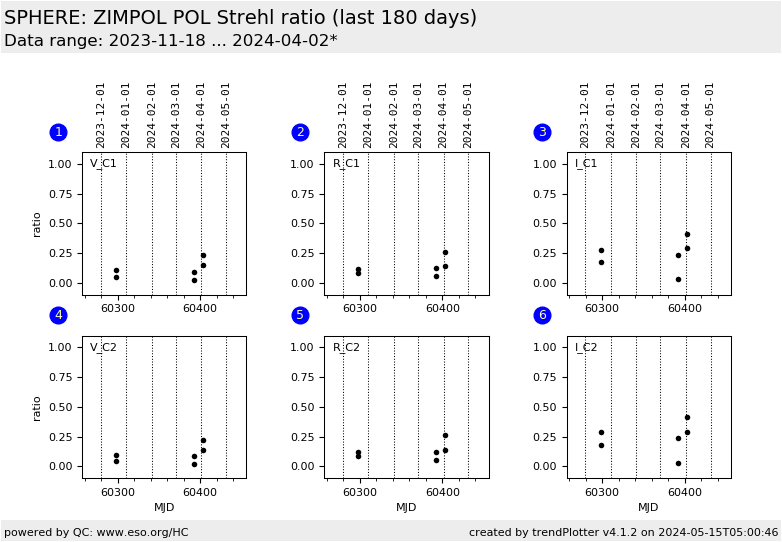
This plot shows the ZIMPOL Strehl ratio for both detectors (labeled C1 and C2) and three broad band filters.
All measurements acquired with closed loop.
General information
Click on any of the plots to see a close-up version.
The latest date is indicated on top of the plot.
If configured,
- data points belonging to the latest date are specially marked
- statistical averages are indicated by a solid line, and thresholds by broken lines
- outliers are marked by a red asterisk. They are defined as data points outside the
threshold lines
- "aliens" (= data points outside the plot Y limits) are marked by a red arrow (↑ or ↓)
- you can download the data for each parameter set if the 'Data downloads' link shows up
|