
Site Information
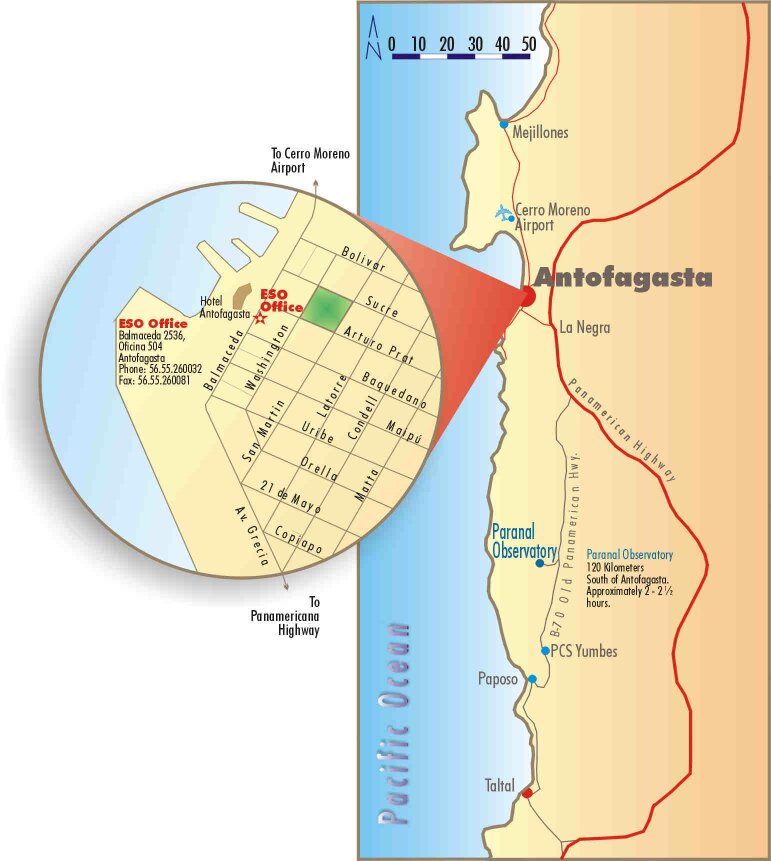
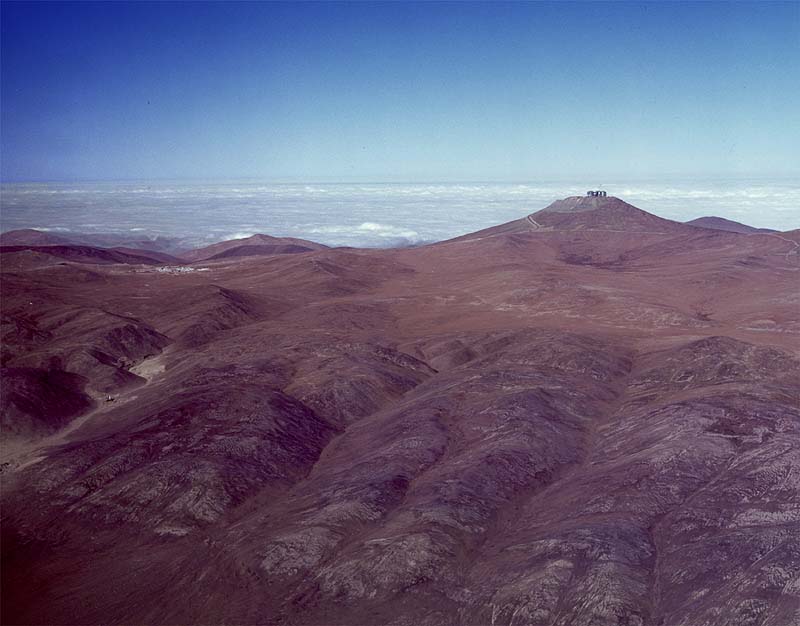
The Paranal Observatory is located on Cerro Paranal in the Atacama Desert in the northern part of Chile (map) and what is believed to be the driest area on Earth. Cerro Paranal is a 2,635-m high mountain, about 120 km south of the town of Antofagasta and 12 km inland from the Pacific Coast. The geographical coordinates are 24o 40' S, 70o 25' W.
Cerro Paranal was chosen because of its excellent atmospheric conditions and its remoteness. This ensures that the front-line astronomical observations carried out there are not disturbed by adverse human activities, e.g. dust and light from roads and mines.
Below is some information about the geography and environment of the Paranal Observatory:
- Geographical Information
- Climate Information
- Seismical Information
- More details: Environmental Statistics
Observational Information
Photometric Nights
Definitions:
- Photometric: no visible clouds above 30 degrees from horizon, transparency variations across the sky less than +- 2%
- Clear: no visible clouds above 30 degrees from horizon, transparency variations across the sky less than 10%
- Thin clouds: thin cirrus with transparency variations >10%
Statistics:
The sky is clear or photometric about 75% of the night time in winter (April-September) and 80% of the night time in the summer (October-March). The fraction of photometric is about 30%. The fraction of usable nights is about 90%.
See also here for long-term data of the sky conditions.
Seeing
The 50% percentile is 0.72" FWHM, see the seeing statistics from 2016 to 2023.
Wind Velocity Distribution
The median (50% percentile) of wind velocity at 30 m above ground is 6.2 m/s, see the statistics over the period 2000 to 2023.
| Altitude above sea level | 2635.43 m |
| Distance from coast | 12 km |
| Highest neighboring peak | Cerro la Chira, 2569 m, 11 km to the NNE |
| Road distances | 130 km to Antofagasta Appr. 1200 km to Santiago Appr. 600 km to La Silla |
| Telescope number | Latitude | Longitude |
| UT1 | -24 deg 37 min 39.44 sec | -70 deg 24 min 18.27 sec |
| UT2 | -24 deg 37 min 37.80 sec | -70 deg 24 min 17.39 sec |
| UT3 | -24 deg 37 min 36.64 sec | -70 deg 24 min 16.32 sec |
| UT4 | -24 deg 37 min 37.36 sec | -70 deg 24 min 14.25 sec |
| VST |
-24 deg 37 min 34.79 sec | -70 deg 24 min 14.27 sec |
| VISTA | -24 deg 36 min 56.52 sec | -70 deg 23 min 51.36 sec |
| Auxiliary Telescope Stations | Latitude | Longitude |
| A0 | -24 deg 37 min 40.59 sec | -70 deg 24 min 18.44 sec |
| A1 | -24 deg 37 min 41.08 sec | -70 deg 24 min 18.26 sec |
| B0 | -24 deg 37 min 40.50 sec | -70 deg 24 min 18.17 sec |
| B1 | -24 deg 37 min 40.99 sec | -70 deg 24 min 17.99 sec |
| B2 | -24 deg 37 min 41.24 sec | -70 deg 24 min 17.89 sec |
| B3 | -24 deg 37 min 41.48 sec | -70 deg 24 min 17.80 sec |
| B4 | -24 deg 37 min 41.73 sec | -70 deg 24 min 17.71 sec |
| B5 | -24 deg 37 min 41.97 sec | -70 deg 24 min 17.62 sec |
| C0 | -24 deg 37 min 40.42 sec | -70 deg 24 min 17.90 sec |
| C1 | -24 deg 37 min 40.91 sec | -70 deg 24 min 17.72 sec |
| C2 | -24 deg 37 min 41.15 sec | -70 deg 24 min 17.63 sec |
| C3 | -24 deg 37 min 41.40 sec | -70 deg 24 min 17.53 sec |
| D0 | -24 deg 37 min 40.25 sec | -70 deg 24 min 17.36 sec |
| D1 | -24 deg 37 min 41.23 sec | -70 deg 24 min 16.99 sec |
| D2 | -24 deg 37 min 41.72 sec | -70 deg 24 min 16.81 sec |
| E0 | -24 deg 37 min 40.08 sec | -70 deg 24 min 16.83 sec |
| G0 | -24 deg 37 min 39.91 sec | -70 deg 24 min 16.29 sec |
| G1 | -24 deg 37 min 41.87 sec | -70 deg 24 min 15.55 sec |
| G2 | -24 deg 37 min 39.18 sec | -70 deg 24 min 16.57 sec |
| H0 | -24 deg 37 min 39.58 sec | -70 deg 24 min 15.21 sec |
| I1 | -24 deg 37 min 40.72 sec | -70 deg 24 min 14.48 sec |
| J1 | -24 deg 37 min 40.06 sec | -70 deg 24 min 14.13 sec |
| J2 | -24 deg 37 min 40.79 sec | -70 deg 24 min 13.85 sec |
| J3 | -24 deg 37 min 37.61 sec | -70 deg 24 min 15.05 sec |
| J4 | -24 deg 37 min 37.12 sec | -70 deg 24 min 15.24 sec |
| J5 | -24 deg 37 min 36.39 sec | -70 deg 24 min 15.52 sec |
| J6 | -24 deg 37 min 35.65 sec | -70 deg 24 min 15.79 sec |
| K0 | -24 deg 37 min 39.24 sec | -70 deg 24 min 14.14 sec |
| L0 | -24 deg 37 min 39.16 sec | -70 deg 24 min 13.87 sec |
| M0 | -24 deg 37 min 39.07 sec | -70 deg 24 min 13.60 sec |
| Air pressure | 750 mbar | ±50 mbar |
| Density | 0.96 kg/m³ | Typ. |
| Temperature | -8° to 25°C | Measured 1985-1990 |
| Temperature gradient during night | -0.4°C/h | Typ. |
| Typ. Humidity | 5-20% | Typ. |
| Rainfall | <10 mm/year | Typ. |
| Snow | Once or twice per year | Typ. |
| Ice buildup | 5 cm | Max. |
| Daily maximum | 1120 W/m² 800 W/m² |
Summer Winter |
| Ozone | 180 μg/m³ |
Max. |
| »Distribution | >10 m/s | 25% of the nights |
| >20 m/s | 50 nights per year | |
| »Long term extremes | 47.2 m/s | 50 years return period |
| 50.7 m/s | 100 years return period | |
| 54.2 m/s | 200 years return period | |
| »Direction | Wind rose | |
| Pollution | NO < 3 ppb | Typ. |
| NO2 < 2 ppb | Typ. | |
| SO2 < 4 ppb | Typ. | |
| Moderate earthquakes | Some times per year | Mg < 7.75 |
| Operating basis earthquake (OBE): | ||
| »Peak horizontal acceleration | 0.24 g | Typ. |
| »Probability of excedance | 50% | |
| »Repetition period | 25 years | |
| »Magnitude | 7.75 | Richter |
| »Hypocentral distance | 100 km | |
| »Duration | 65 s | |
| Max. likely earthquake (MLE): | ||
| »Peak horizontal acceleration | 0.34 g | Typ. |
| »Probability of excedance | 10 % | |
| »Repetition period | 100 years | |
| »Magnitude | 8.5 | Richter |
| »Hypocentral distance | 150 km | |
| »Duration | 200 s |