| This documentation is intended both for QC scientists and SciOps astronomers (who may want to ignore the technical information displayed in grey). | |||||||||||||||||||||||||||||
|
|||||||||||||||||||||||||||||
|
|||||||||||||||||||||||||||||
| bottom plots | contact | |||||||||||||||||||||||||||||
| NAME | wave.prg | ||||||||||||||||||||||||||||
| VERSION |
1.0 -- January 2004 1.1 -- modified for improved wavecal recipe (2004-02-18) 1.2 -- includes ORDER and SETTING (2004-04-28) 1.3 -- reads QC params (2005-04-28) 1.4 -- includes LAMP.EFFIC and RESOL parameters (2008-01-29) 1.5 -- fudge factors turned off (2008-09-24) 1.6 -- overexpo check added (2011-05-31) 1.7 -- description update for extended format (2017-04-06) | ||||||||||||||||||||||||||||
| SYNTAX | MIDAS | ||||||||||||||||||||||||||||
| CALL |
processQC -a abname; or: from $DFS_PRODUCT/WAVE/$DATE inmidas -P -j "@@ $DFO_PROC_DIR/wave.prg $date $primfile" | ||||||||||||||||||||||||||||
| INSTRUMENT | GIRAFFE | ||||||||||||||||||||||||||||
| RAWTYPE | WAVE | ||||||||||||||||||||||||||||
| PURPOSE | compares raw and product WAVE files for FLAMES/GIRAFFE QC assessment. The first plot (wave1.gif) is stored in $DFO_PLT_DIR. | ||||||||||||||||||||||||||||
| PROCINPUT |
raw ARCLAMP frame; products analyzed: ARC_RBNSPECTRA, ARC_EXTSPECTRA, DISPERSION_SOLUTION; LINE_TABLE | ||||||||||||||||||||||||||||
| QC1TABLE |
trending | table(s) in QC1 database: giraffe_wave | ||||||||||||||||||||||||||||
| TRENDPLOT |
trending | HealthCheck plot(s) associated to this procedure: trend_report_ARCLAMP_HC.html | trend_report_ARC_RMS_HC.html | trend_report_ARC_NLIN_HC.html | trend_report_ARC_RESOL_HC.html | ||||||||||||||||||||||||||||
| QC1PAGE |
trending | associated documentation: lamp_qc1.html#arclamp | wave_qc1.html | ||||||||||||||||||||||||||||
| QC1PLOTS top |
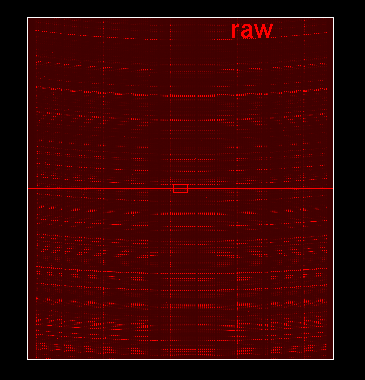
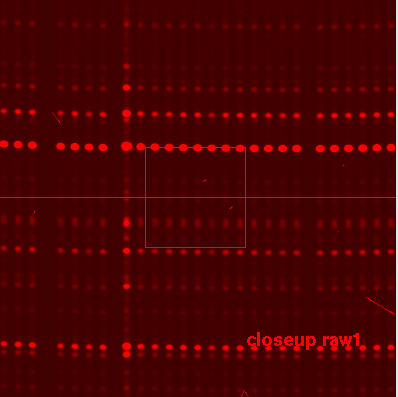
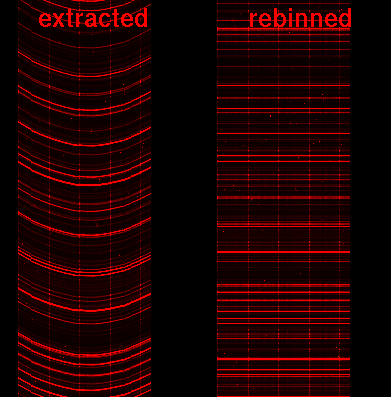
wave1.gif box1: middle row in first raw (shows the fibre pattern); box2: closeup of box1 (X950-1050), for checking the cross-dispersion profiles box3: histogram (log frequency) of FWHM values across WAVE frame (from product LINE_DATA, extname FWHM) box4: histogram (log frequency) of highest pixel values (>50,000 ADU) to check for overexposure box5: rebinned spectrum, central part (as marked in plot4 by red broken lines); upper panel: signal in fibre #3, with line positions from the ThAr line list marked; flux scale is logarithmic lower panel: difference plot (all fibres X collapsed minus #3); it should be a straight line around 0, no curvature, no strong scatter on the scale used here box6: full rebinned spectrum, format as in box5 wave2.png full display of raw frame (box: area displayed in wave3.png) wave3.png closeup of raw frame (box: area displayed in the graphical plot as box 2); each emission line and fibre is visible as bright circle. wave4.png display of extracted (left) and rebinned (right) pipeline product; the extracted frame shows each fibre signal in Y-pixel space (curvature of each emission line visible, occasional discontinuities due to simcal gaps); the rebinned frame shows the arclamp frame rebinned with its own dispersion solution, it should be straight in each emission line. Check especially the very top and very bottom parts (you may want to use the rtd image for better exploring, type 'yes' in 'display details?' part of certifyProducts. Check also for small-scale jumps between fibre groups (being due to imperfect slit_geometry table). | ||||||||||||||||||||||||||||
| QC1PARAM |
QC1 parameters written into QC1 table: QC1_db names: lamp_effic | nlin_tot | nlin_acc | rms_fit | rms_diff | num_fib | mean_resol | rms_resol FITS key names: QC.LAMP.EFFIC | PRO.WSOL.LINE.NLINES | PRO.WSOL.LINE.NACCEPT | PRO.WSOL.RMS | PRO.REBIN.NS | QC.LAMP.EFFIC | QC.RESOL.MEAN | QC.RESOL.RMS Most QC1 parameters are created by pipeline and read from header. PRO.WSOL.LINE.NACCEPT is re-calculated to represent the average number of lines per fibre. QC.LAMP.EFFIC is calculated with the SIMCAL fibres excluded. | ||||||||||||||||||||||||||||
| ALGORITHM |
Description of algorithms: see http://www.eso.org/qc/GIRAFFE/qc/wave_qc1.html | ||||||||||||||||||||||||||||
| CERTIF |
Reasons for rejection: high values in rms_fit (strong scatter across frame); low nlin_acc; lamp_effic too low; | ||||||||||||||||||||||||||||
| COMMENTS |
Insertion of QC parameters started in June 2006. Scoring: num_fib | rms_fit | nlin_acc | mean_resol | lamp_effic (this only for HC settings) HC plots for HC settings only All pipeline-provided QC1 parameters are documented in the pipeline users manual (as of issue 2, 2007-12-28) | ||||||||||||||||||||||||||||
| top | [2017-04-07T09:23:20] created by qcDocu v1.1.2, a tqs tool | ||||||||||||||||||||||||||||