Plot
? |
Symb
? |
Source
* |
OPS?
** |
Average ? |
Thresholds ? |
N_
data |
QC1
parameter |
Data
downloads |
Remarks |
| method |
value |
unit |
method |
value |
| 1 |
• | QC1DB |
no |
MEDIAN |
163 |
NONE |
VAL | 0,775 |
86 |
badpix |
this |
last_yr |
all
|
bad pixels, chip 1, WREF=3218.6 |
| 2 |
• | QC1DB |
no |
MEDIAN |
735 |
NONE |
VAL | 0,1000 |
87 |
badpix |
this |
last_yr |
all
|
bad pixels, chip 2, WREF=3218.6 |
| 3 |
• | QC1DB |
no |
MEDIAN |
532 |
NONE |
VAL | 0,1200 |
88 |
badpix |
this |
last_yr |
all
|
bad pixels, chip 3, WREF=3218.6 |
| 4 |
• | QC1DB |
no |
MEDIAN |
3016 |
NONE |
VAL | 0,3200 |
88 |
badpix |
this |
last_yr |
all
|
bad pixels, chip 4, WREF=3218.6 |
| |
|
*Data sources: QC1DB: QC1 database; LOCAL: local text file | **OPS: OPSLOG data are included
|
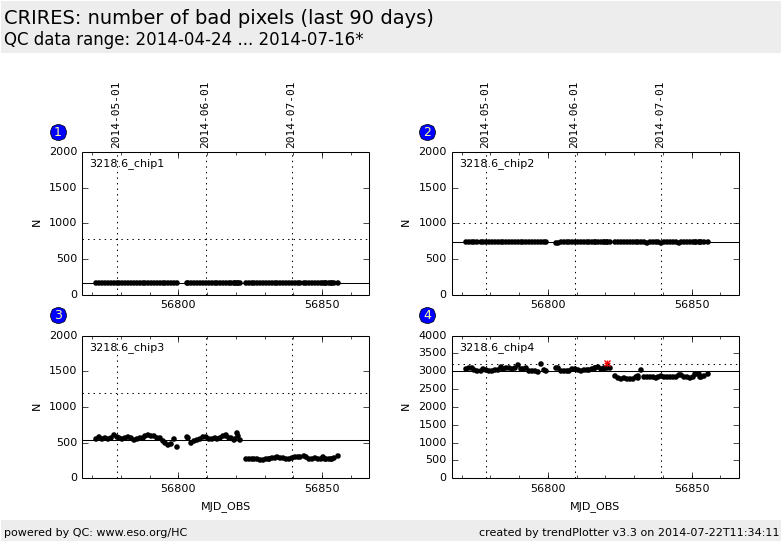
Plot 1
scores:  8| 8|
| | data source: | crires_flat
(QC1 database) |
| dataset: | badpix | • |
| median: | 163 | NONE |
| fixed thresholds: | 0...775 | NONE |
| N_data plotted: | 86 |
| [click on plot for closeup] |
Plot 2
scores: 8|
| | data source: | crires_flat
(QC1 database) |
| dataset: | badpix | • |
| median: | 735 | NONE |
| fixed thresholds: | 0...1000 | NONE |
| N_data plotted: | 87 |
| [click on plot for closeup] |
Plot 3
scores: 8|
| | data source: | crires_flat
(QC1 database) |
| dataset: | badpix | • |
| median: | 532 | NONE |
| fixed thresholds: | 0...1200 | NONE |
| N_data plotted: | 88 |
| [click on plot for closeup] |
Plot 4
scores: 8|
| | data source: | crires_flat
(QC1 database) |
| dataset: | badpix | • |
| median: | 3016 | NONE |
| fixed thresholds: | 0...3200 | NONE |
| N_data plotted: | 88 |
| [click on plot for closeup] |
Trending plots monitoring the number of bad pixels.
The number of bad pixels is derived from flat fields. The monitoring is for
the setting with reference wavelength 3218.6 nm since these flats give a
stable number of bad pixels. Paranal values are currently not plotted because
they differ from QC Garching values due to different pipeline configuration
(i.e. different thresholds for bad pixel detection).
General information
Click on any of the plots to see a close-up version.
The latest date is indicated on top of the plot, data points belonging to that date are specially marked.
If configured,
- statistical averages are indicated by a solid line, and thresholds by broken lines
- outliers are marked by a red asterisk. They are defined as data points outside the
threshold lines
- "aliens" (= data points outside the plot Y limits) are marked by a red arrow (↑ or ↓)
- you can download the data for each parameter set if the 'Data downloads' link shows up
|

