Plot
? |
Symb
? |
Source
* |
OPS?
** |
Average ? |
Thresholds ? |
N_
data |
QC1
parameter |
Data
downloads |
Remarks |
| method |
value |
unit |
method |
value |
| 1 |
• | QC1DB |
no |
MEDIAN |
0.0409 |
NONE |
none | |
7 |
lineff |
this |
last_yr |
all
|
effective non-linearity at 6000ADU, chip 1 |
| 2 |
• | QC1DB |
no |
MEDIAN |
0.0461 |
NONE |
none | |
7 |
lineff |
this |
last_yr |
all
|
effective non-linearity at 6000ADU, chip 2 |
| 3 |
• | QC1DB |
no |
MEDIAN |
0.0467 |
NONE |
none | |
7 |
lineff |
this |
last_yr |
all
|
effective non-linearity at 6000ADU, chip 3 |
| 4 |
• | QC1DB |
no |
MEDIAN |
0.043 |
NONE |
none | |
7 |
lineff |
this |
last_yr |
all
|
effective non-linearity at 6000ADU, chip 4 |
| 5 |
• | QC1DB |
no |
MEDIAN |
9634 |
ADU |
VAL | 6000,12000 |
7 |
counts_max |
this |
last_yr |
all
|
maximimum exposure level, chip 1 |
| 6 |
• | QC1DB |
no |
MEDIAN |
10566 |
ADU |
VAL | 6000,12000 |
7 |
counts_max |
this |
last_yr |
all
|
maximimum exposure level, chip 2 |
| 7 |
• | QC1DB |
no |
MEDIAN |
9726 |
ADU |
VAL | 6000,12000 |
7 |
counts_max |
this |
last_yr |
all
|
maximimum exposure level, chip 3 |
| 8 |
• | QC1DB |
no |
MEDIAN |
10146 |
ADU |
VAL | 6000,12000 |
7 |
counts_max |
this |
last_yr |
all
|
maximimum exposure level, chip 4 |
| |
|
*Data sources: QC1DB: QC1 database; LOCAL: local text file | **OPS: OPSLOG data are included
|
Plot 1
scores:  1| 1|
| | data source: | crires_detmon
(QC1 database) |
| dataset: | lineff | • |
| median: | 0.0409 | NONE |
| thresholds: | none | |
| N_data plotted: | 7 |
| [click on plot for closeup] |
Plot 2
scores: 1|
| | data source: | crires_detmon
(QC1 database) |
| dataset: | lineff | • |
| median: | 0.0461 | NONE |
| thresholds: | none | |
| N_data plotted: | 7 |
| [click on plot for closeup] |
Plot 3
scores: 1|
| | data source: | crires_detmon
(QC1 database) |
| dataset: | lineff | • |
| median: | 0.0467 | NONE |
| thresholds: | none | |
| N_data plotted: | 7 |
| [click on plot for closeup] |
Plot 4
scores:  1| 1|
| | data source: | crires_detmon
(QC1 database) |
| dataset: | lineff | • |
| median: | 0.043 | NONE |
| thresholds: | none | |
| N_data plotted: | 7 |
| [click on plot for closeup] |
Plot 5
scores: 1|
| | data source: | crires_detmon
(QC1 database) |
| dataset: | counts_max | • |
| median: | 9634 | ADU |
| fixed thresholds: | 6000...12000 | ADU |
| N_data plotted: | 7 |
| [click on plot for closeup] |
Plot 6
scores: 1|
| | data source: | crires_detmon
(QC1 database) |
| dataset: | counts_max | • |
| median: | 10566 | ADU |
| fixed thresholds: | 6000...12000 | ADU |
| N_data plotted: | 7 |
| [click on plot for closeup] |
Plot 7
scores:  1| 1|
| | data source: | crires_detmon
(QC1 database) |
| dataset: | counts_max | • |
| median: | 9726 | ADU |
| fixed thresholds: | 6000...12000 | ADU |
| N_data plotted: | 7 |
| [click on plot for closeup] |
Plot 8
scores: 1|
| | data source: | crires_detmon
(QC1 database) |
| dataset: | counts_max | • |
| median: | 10146 | ADU |
| fixed thresholds: | 6000...12000 | ADU |
| N_data plotted: | 7 |
| [click on plot for closeup] |
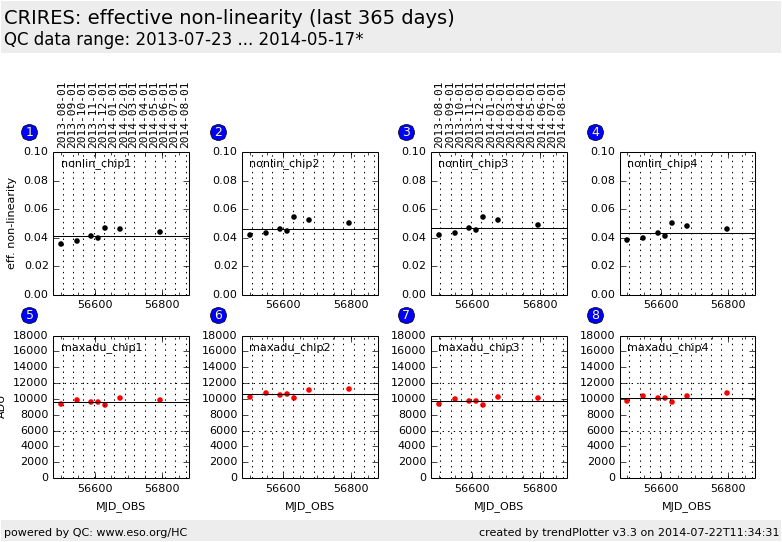
Trending plot for non-linearity measurements of the CRIRES detector.
Data are taken from detector monitoring calibrations which are series of flat
fields with increasing DITs and corresponding darks. A second order polynomial
is fit to the data (flux vs. exposure time for each pixel).
The trending shows the average effective non-linearity at 6000 ADU and the maximum
exposure level (in ADU) from the frame with the highest DIT.
Effective
non-linearity is the difference between the flux predicted at 6000 ADU by the
linear term and the flux obtained from the polynomial, normalized by
the polynomial flux.
The average effective non-linearity should be less than 0.1. In order to
correctly calculate this parameter, the maximum flux should be above 6000 ADU
on all detectors. It should also be below 12000 ADU because the CRIRES array
becomes highly non-linear above.
General information
Click on any of the plots to see a close-up version.
The latest date is indicated on top of the plot, data points belonging to that date are specially marked.
If configured,
- statistical averages are indicated by a solid line, and thresholds by broken lines
- outliers are marked by a red asterisk. They are defined as data points outside the
threshold lines
- "aliens" (= data points outside the plot Y limits) are marked by a red arrow (↑ or ↓)
- you can download the data for each parameter set if the 'Data downloads' link shows up
|

