Plot
? |
Symb
? |
Source
* |
OPS?
** |
Average ? |
Thresholds ? |
N_
data |
QC1
parameter |
Data
downloads |
Remarks |
| method |
value |
unit |
method |
value |
| 1 |
• | QC1DB |
no |
MEAN |
8.97e+03 |
ADU |
VAL | 5000,10500 |
71 |
qc_cc_med |
this |
last_yr |
all
|
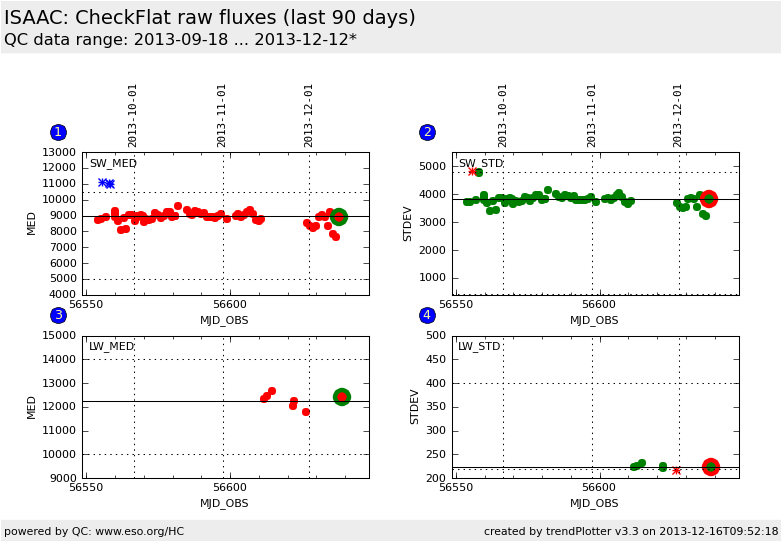
raw SW checkflat counts in central 100x100 pixel window |
| 2 |
• | QC1DB |
no |
MEAN |
3.83e+03 |
ADU |
VAL | 420,4800 |
71 |
qc_cc_stdev |
this |
last_yr |
all
|
raw SW checkflat counts stdev in central 100x100 pixel window |
| 3 |
• | QC1DB |
no |
MEAN |
1.23e+04 |
ADU |
VAL | 10000,14000 |
7 |
qc_cc_med |
this |
last_yr |
all
|
raw LW checkflat counts in central 100x100 pixel window |
| 4 |
• | QC1DB |
no |
MEAN |
224 |
ADU |
VAL | 220,400 |
7 |
qc_cc_stdev |
this |
last_yr |
all
|
raw LW checkflat counts stdev in central 100x100 pixel window |
| |
|
*Data sources: QC1DB: QC1 database; LOCAL: local text file | **OPS: OPSLOG data are included
|
Plot 1
scores:  7| 7|
| | data source: | isaac_checkflat
(QC1 database) |
| dataset: | qc_cc_med | • |
| mean: | 8.97e+03 | ADU |
| fixed thresholds: | 5000...10500 | ADU |
| N_data plotted: | 71 |
| [click on plot for closeup] |
Plot 2
scores: no current data
| | data source: | isaac_checkflat
(QC1 database) |
| dataset: | qc_cc_stdev | • |
| mean: | 3.83e+03 | ADU |
| fixed thresholds: | 420...4800 | ADU |
| N_data plotted: | 71 |
| [click on plot for closeup] |
Plot 3
scores: not implemented
| | data source: | isaac_checkflat
(QC1 database) |
| dataset: | qc_cc_med | • |
| mean: | 1.23e+04 | ADU |
| fixed thresholds: | 10000...14000 | ADU |
| N_data plotted: | 7 |
| [click on plot for closeup] |
Plot 4
scores: not implemented
| | data source: | isaac_checkflat
(QC1 database) |
| dataset: | qc_cc_stdev | • |
| mean: | 224 | ADU |
| fixed thresholds: | 220...400 | ADU |
| N_data plotted: | 7 |
| [click on plot for closeup] |
This is the trending plot of the daily check flat
taken as part of the daily health check procedure.
This plot describes the fluxes derived from RAW checkflat
frames in the central area from (462,462 pix to 562,562 pix,
size=100x100 [pix pix]) for both SW and LW arms
Find more information about ISAAC checkflat frames
here.
General information
Click on any of the plots to see a close-up version.
The latest date is indicated on top of the plot, data points belonging to that date are specially marked.
If configured,
- statistical averages are indicated by a solid line, and thresholds by broken lines
- outliers are marked by a red asterisk. They are defined as data points outside the
threshold lines
- "aliens" (= data points outside the plot Y limits) are marked by a red arrow (↑ or ↓)
- you can download the data for each parameter set if the 'Data downloads' link shows up
|

