This tutorial provides information for the Echelle grating position.
It is based on the measurement of QC1 parameters of FORMAT CHECK calibration data.
These are obtained with dedicated Health Check OBs executed daily. These OBs obtain four sets of FORMAT CHECK data, 2 sets in BLUE mode and 2 sets in RED mode, each set comprising a single RAW frame. Each set is acquired in a different wavelength setting covering the two arms and the four cross dispersers.
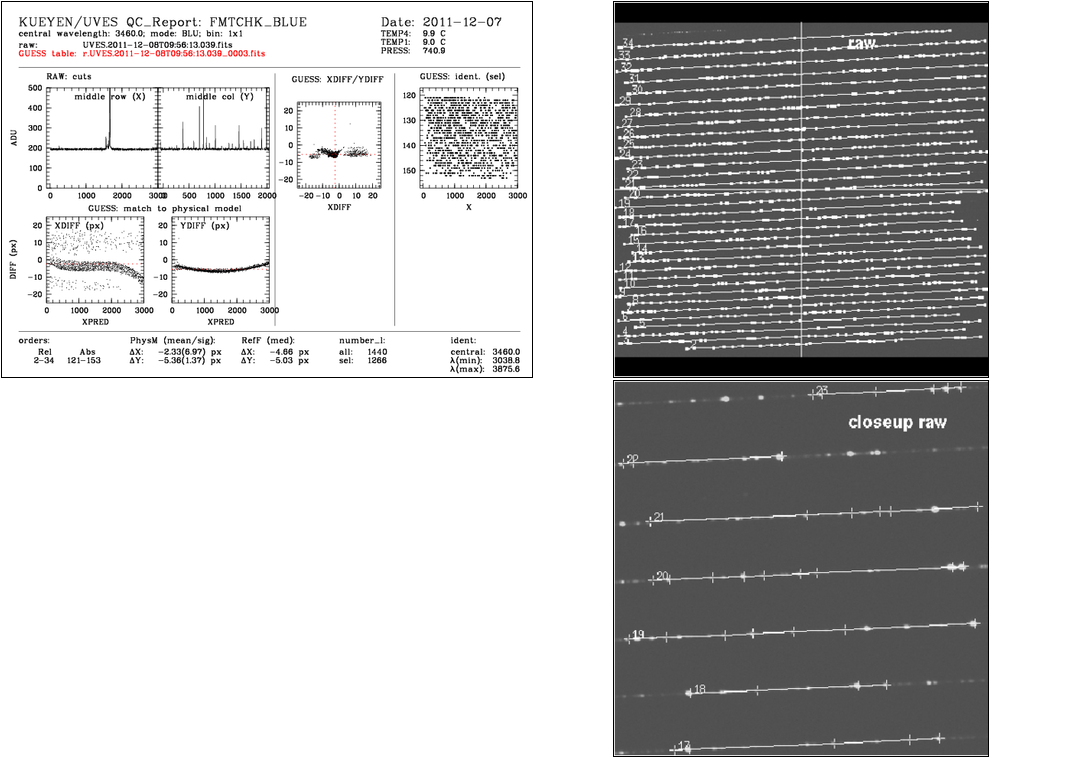
plot 1:trace across the central row of the RAW frame
plot 2:trace across the central column of the RAW frame
plot 3:XDIFF vs YDIFF plot, where XDIFF & YDIFF are the differences measured positions of each line with respect to the positions expected from the physical model. Ideally the points in this plot should clusted about 0,0, but the pipeline seems capable to cope with deviations of upto -10,+10 in both axes (the pipeline developer expects 'problems' at values much larger than +/-10 however this range has not been 'explored' in normal operations). Jumps (of completely unpredicatable nature) are often seem in these parameters due to earthquakes and any other influence (e.g. maintenance/intervention operations) which 'disturb' the instrument. Jumps in BLUE and RED arms can be completely UNCORRELATED.
plot 4:Distribution of located lines by echelle order
plot 5:XDIFFs (as above) as a function of position along each order
plot 6:YDIFFs (as above) as a function of position along each order
Right, top 1: full display of raw frame
Right, lower 1: closeup display of master frame
There is also a compensation for the thermal drift (X and Y) which has been introduced. This is visible under the Thermal plots.
The trending of the FMTCHK during the life time of the instrument is best be seen with the full history FMTCHK trending plots shown here: FULL FMTCHK history.
mean_dx, mean_dy, sigma_dx, sigma_dy: The physical model used in Formatcheck step allows to measure the difference between model predicted and detected line positions. This is useful to verify precision of physical model prediction and instrument spectral format stability. the parameters mean_dx/y represent the difference of X/Y positions to physical model, the sigma : the rms of difference to the physical model
median_shftx, median_shfty: median of difference in X to reference frame (stability check)
nlin_all: The physical model used in the Formatcheck step allows to predict line positions on the formatcheck frame. This is the total number of predicted matching lines.
nlin_sel: The physical model used in the Formatcheck step allows to predict line positions on the formatcheck frame. The selected number of lines is the subset of the total number of lines which fall in the physical model plot limits.
 Grating Position (FMTCHK) parameters