This tutorial provides information for the BIAS Health Check trending. It is based on the measurement of QC1 parameters of BIAS calibration data obtained with dedicated Health Check OBs executed daily. These OBs obtain four sets of BIAS data, 2 sets in BLUE mode and 2 sets in RED mode, each set comprising 5 RAW frames. The 2 sets in each mode are acquired in the two main CCD ReadOut modes:; 225kHz, low gain, 1x1 and 50kHz, high gain, 2x2.
These data thus give detailed charateristics for all THREE UVES CCDs, one BLUE and two RED (UPPER and LOWER).
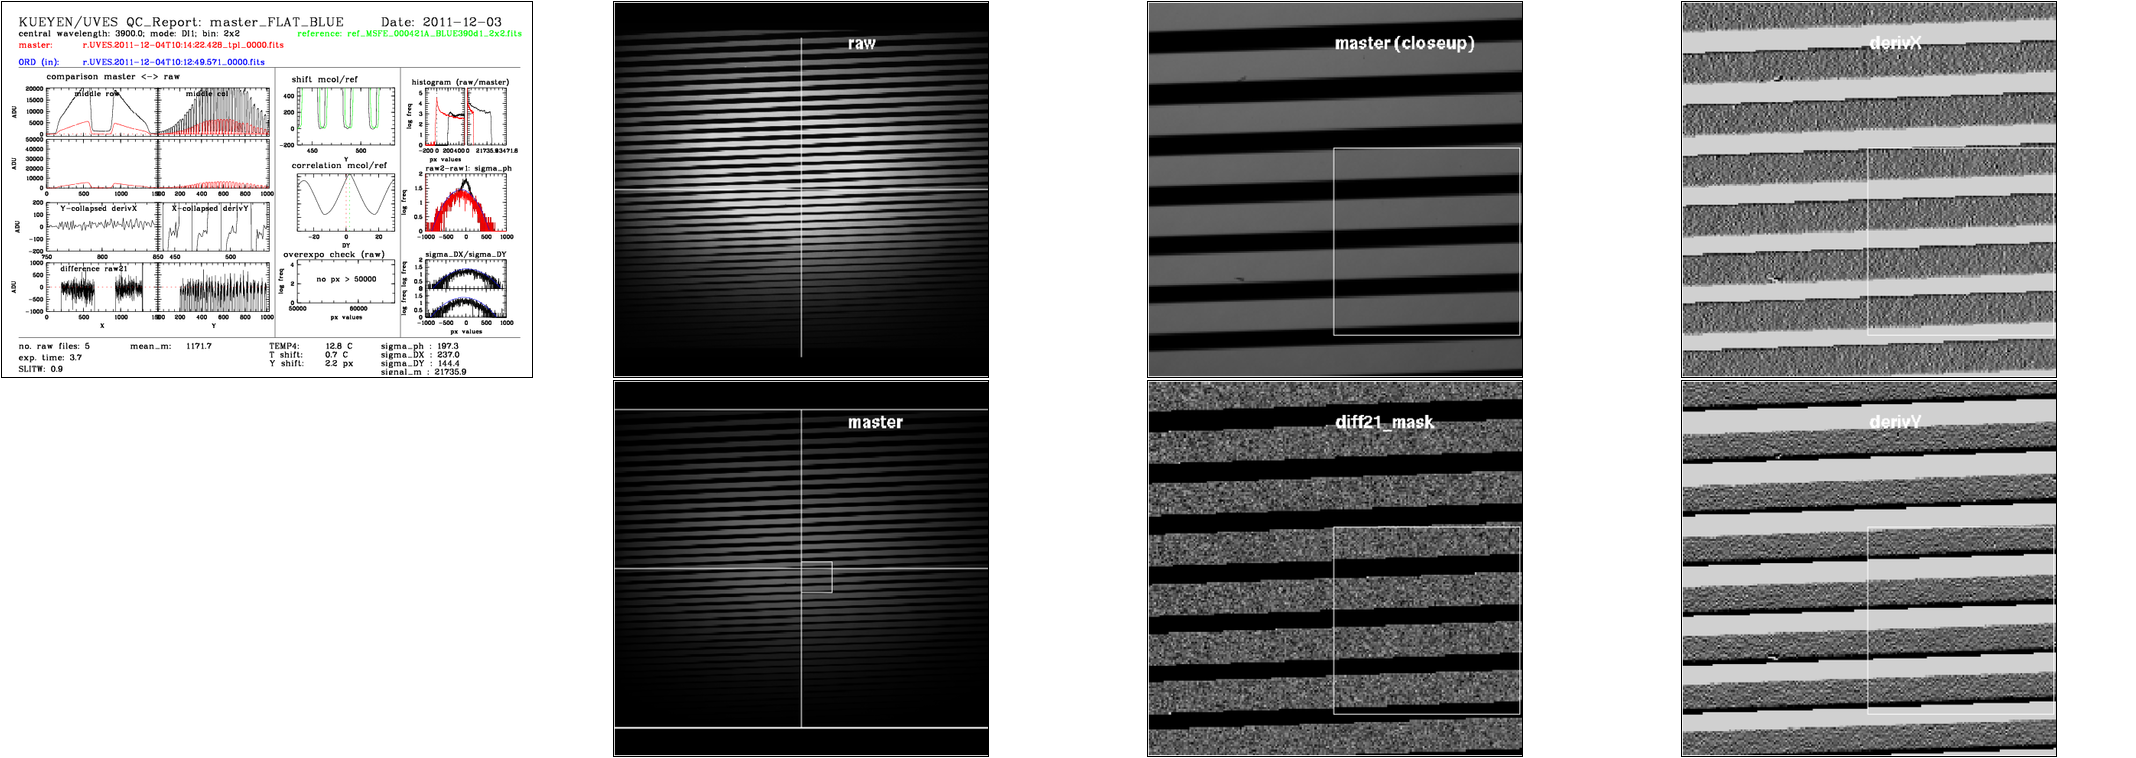
The montage displays:
box 1, left to right, top to bottom:
plot 1:trace across the middle row of the RAW frame (black) and the MASTER_[E|D|T]FLAT_BLUE (red), the master flats are background subtracted and normalised to a 1sec exposure time hense the different signal level.
plot 2:trace across the middle column of the RAW frame (black) and the MASTER_[E|D|T]FLAT_BLUE (red)
plot 3:trace across the middle row of the MASTER_[E|D|T]FLAT_BLUE (red), as in plot 1 but at a different (not necessarily well adjusted for all MODE/WL/BINNING settings) scale
plot 4:trace across the middle column of the MASTER_[E|D|T]FLAT_BLUE (red), as in plot 2 but at a different scale
plot 5:Y-collapsed derivX: row averaged trace of the central region of the derivX image WITHOUT masking of the inter-order space
plot 6:X-collapsed derivY: column averaged trace of the central region of the of the derivY image WITH masking of the inter-order space
plot 7:difference raw21: trace across the central row (zooming on the central 100 pixels) of the diff21_mask (difference of first and second frames with inter-order space pixels 'masked to -10,000) frame
plot 8: trace across the central column (zooming on the central 100 pixels) of the diff21_mask frame
box 2, left to right, top to bottom:
plot 9:shift mcol/ref: shift of the current master flat (black) with respect to the reference master flat (green, ref_MSFE*.fits in $DFO_CAL_DIR/refs with matching wavelength, binning and INS.PATH (BLUE, RED, DICHR#1 or DICHR#2))
plot 10:correlation mcol/ref: cross correlation function between the current master flat and the reference master flat (as above) to visualize acurrately the offset between the two.
plot 11:overexpo check (raw): visual check for over exposure in the first RAW frame, histogram of pixel values.
box 3, left to right, top to bottom:
plot 12:histogram (raw/master): pixel value histograms of the first raw frame (black) and master flat (red), close up on low ADU values (left) and full range (right) plot 13:raw2-raw1: sigma_ph: histograms of the diff21 (black, direct difference of first and second frames) and diff21_mask (red) frames, the black "bump" above the red histogram thus represents the inter-order pixels. The overploted blue gaussian line is simply the gaussian derived from the mean and standard deviation values computed by MIDAS stat/imag command of the diff21_mask frame. plot 14:sigma_DX/sigma_DY: histograms of the derivX (top) and derivY (bottom) frames with overplotted gaussians derived from the mean and standard deviation values computed by MIDAS stat/imag command of the derivX & derivY frames.
delta_temp4 is calculated by the QC report script. It represents the difference between INS.TEMP4.MEAN of current master flat and a reference master flat with matching wavelength, binning and INS.PATH (BLUE, RED, DICHR#1 or DICHR#2))
delta_y: The difference between the position of the peak of the cross-correlation function between current master flat and the reference master flat is defined.
mean_master: taken from the header of the first RAW file, it propagates to the PRODUCT file(s) unchanged by the pipeline.
signal_master: mean value across subwindow, this QC parameter is currently calculated by the QC report script.
sigma_ph: photon noise across subwindow, this QC parameter is currently calculated by the QC report script.
sigma_dx/dy: noise from DX/DY derivative, this QC parameter is currently calculated by the QC report script.
 Parameters trended