Plot
? |
Symb
? |
Source
* |
Average ? |
Thresholds ? |
N_
data |
QC1
parameter |
Data
downloads |
Remarks |
| method |
value |
unit |
method |
value |
| 1 |
• | QC1DB |
MEDIAN |
1.21 |
ADU |
VAL | 1.0,1.5 |
85 |
rms_master |
this |
last_yr |
all
|
Q2, rms of master, low gain |
| 2 |
• | QC1DB |
MEDIAN |
1.21 |
ADU |
VAL | 1.0,1.5 |
85 |
rms_master |
this |
last_yr |
all
|
Q1, rms of master, low gain |
| 3 |
• | QC1DB |
MEDIAN |
3.1 |
ADU |
VAL | 2.9,3.4 |
87 |
rms_master |
this |
last_yr |
all
|
Q2, rms of master, high gain |
| 4 |
• | QC1DB |
MEDIAN |
3.2 |
ADU |
VAL | 3.0,3.5 |
87 |
rms_master |
this |
last_yr |
all
|
Q1, rms of master, high gain |
| 5 |
• | QC1DB |
MEDIAN |
1.15 |
ADU |
VAL | 1.0,1.5 |
85 |
rms_master |
this |
last_yr |
all
|
Q3, rms of master, low gain |
| 6 |
• | QC1DB |
MEDIAN |
1.16 |
ADU |
VAL | 0.8,1.3 |
85 |
rms_master |
this |
last_yr |
all
|
Q4, rms of master, low gain |
| 7 |
• | QC1DB |
MEDIAN |
3.03 |
ADU |
VAL | 2.9,3.4 |
87 |
rms_master |
this |
last_yr |
all
|
Q3, rms of master, high gain |
| 8 |
• | QC1DB |
MEDIAN |
3.13 |
ADU |
VAL | 2.8,3.3 |
87 |
rms_master |
this |
last_yr |
all
|
Q4, rms of master, high gain |
| |
|
*Data sources: QC1DB: QC1 database; LOCAL: local data source
|
Plot 1
scores:  6| 6|
| | data source: | vimos_bias
(QC1 database) |
| dataset: | rms_master | • |
| median: | 1.21 | ADU |
| fixed thresholds: | 1.0...1.5 | ADU |
| N_data plotted: | 85 |
| [click plot for closeup] |
Plot 2
scores: 6|
| | data source: | vimos_bias
(QC1 database) |
| dataset: | rms_master | • |
| median: | 1.21 | ADU |
| fixed thresholds: | 1.0...1.5 | ADU |
| N_data plotted: | 85 |
| [click plot for closeup] |
Plot 3
scores: 6|
| | data source: | vimos_bias
(QC1 database) |
| dataset: | rms_master | • |
| median: | 3.1 | ADU |
| fixed thresholds: | 2.9...3.4 | ADU |
| N_data plotted: | 87 |
| [click plot for closeup] |
Plot 4
scores: 6|
| | data source: | vimos_bias
(QC1 database) |
| dataset: | rms_master | • |
| median: | 3.2 | ADU |
| fixed thresholds: | 3.0...3.5 | ADU |
| N_data plotted: | 87 |
| [click plot for closeup] |
Plot 5
scores: 6|
| | data source: | vimos_bias
(QC1 database) |
| dataset: | rms_master | • |
| median: | 1.15 | ADU |
| fixed thresholds: | 1.0...1.5 | ADU |
| N_data plotted: | 85 |
| [click plot for closeup] |
Plot 6
scores: 6|
| | data source: | vimos_bias
(QC1 database) |
| dataset: | rms_master | • |
| median: | 1.16 | ADU |
| fixed thresholds: | 0.8...1.3 | ADU |
| N_data plotted: | 85 |
| [click plot for closeup] |
Plot 7
scores: 6|
| | data source: | vimos_bias
(QC1 database) |
| dataset: | rms_master | • |
| median: | 3.03 | ADU |
| fixed thresholds: | 2.9...3.4 | ADU |
| N_data plotted: | 87 |
| [click plot for closeup] |
Plot 8
scores: 6|
| | data source: | vimos_bias
(QC1 database) |
| dataset: | rms_master | • |
| median: | 3.13 | ADU |
| fixed thresholds: | 2.8...3.3 | ADU |
| N_data plotted: | 87 |
| [click plot for closeup] |
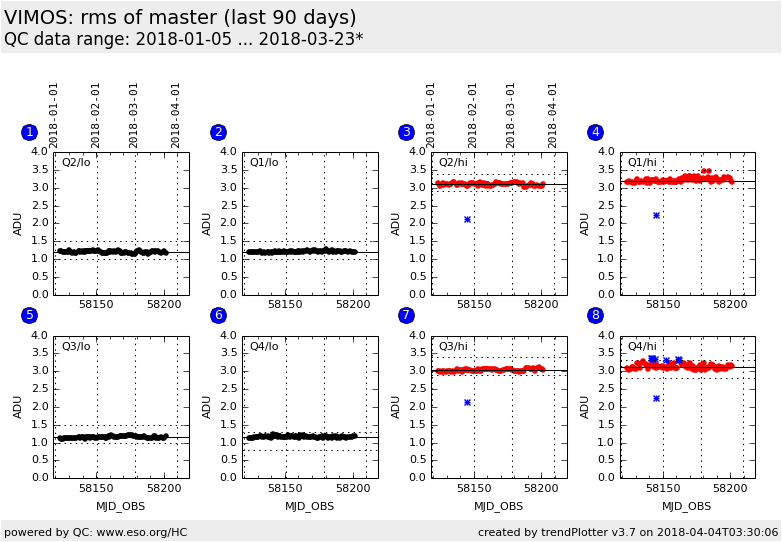
Trending plots for bias QC parameters.
All bias parameters are measured in the central 1600x1800 pixels of the
detectors. The median bias level and the rms of the master should show a
stable trend without sudden jumps or increase/decrease. The read-out
noise (ron_raw) is calculated from the difference of the first two raw frames.
Some outliers with high values are occasionally observed due to cosmic
ray events. The read-out noise as measured from master frames (ron_master)
should be extremely stable.
The new detectors (since July 2010) show a correlation of the bias level with temperature,
especially for quadrant 2.
Bias frames are usually measured daily during day-time. They come in two
different varieties: with low gain (used for imaging) and with high gain (used
to calibrate the spectroscopic modes).
Template IDs: img_cal_Dark and spec_cal_Dark. Pipeline recipe: vmbias.
General information
Click on any of the plots to see a close-up version.
The latest date is indicated on top of the plot.
If configured,
- data points belonging to the latest date are specially marked
- statistical averages are indicated by a solid line, and thresholds by broken lines
- outliers are marked by a red asterisk. They are defined as data points outside the
threshold lines
- "aliens" (= data points outside the plot Y limits) are marked by a red arrow (↑ or ↓)
- you can download the data for each parameter set if the 'Data downloads' link shows up
|
