Plot
? |
Symb
? |
Source
* |
Average ? |
Thresholds ? |
N_
data |
QC1
parameter |
Data
downloads |
Remarks |
| method |
value |
unit |
method |
value |
| 1 |
• | QC1DB |
MEDIAN |
0.402 |
pix |
VAL | 0,0.6 |
35 |
ids_rms |
this |
last_yr |
all
|
Q2, rms of dispersion solution |
| 2 |
• | QC1DB |
MEDIAN |
0.389 |
pix |
VAL | 0,0.6 |
35 |
ids_rms |
this |
last_yr |
all
|
Q1, rms of dispersion solution |
| 3 |
• | QC1DB |
MEDIAN |
0.382 |
pix |
VAL | 0,0.5 |
35 |
ids_rms |
this |
last_yr |
all
|
Q3, rms of dispersion solution |
| 4 |
• | QC1DB |
MEDIAN |
0.373 |
pix |
VAL | 0,0.4 |
35 |
ids_rms |
this |
last_yr |
all
|
Q4, rms of dispersion solution |
| |
|
*Data sources: QC1DB: QC1 database; LOCAL: local data source
|
Plot 1
scores:  6| 6|
| | data source: | vimos_ifu_score
(QC1 database) |
| dataset: | ids_rms | • |
| median: | 0.402 | pix |
| fixed thresholds: | 0...0.6 | pix |
| N_data plotted: | 35 |
| [click plot for closeup] |
Plot 2
scores: 6|
| | data source: | vimos_ifu_score
(QC1 database) |
| dataset: | ids_rms | • |
| median: | 0.389 | pix |
| fixed thresholds: | 0...0.6 | pix |
| N_data plotted: | 35 |
| [click plot for closeup] |
Plot 3
scores: 6|
| | data source: | vimos_ifu_score
(QC1 database) |
| dataset: | ids_rms | • |
| median: | 0.382 | pix |
| fixed thresholds: | 0...0.5 | pix |
| N_data plotted: | 35 |
| [click plot for closeup] |
Plot 4
scores: 6|
| | data source: | vimos_ifu_score
(QC1 database) |
| dataset: | ids_rms | • |
| median: | 0.373 | pix |
| fixed thresholds: | 0...0.4 | pix |
| N_data plotted: | 35 |
| [click plot for closeup] |
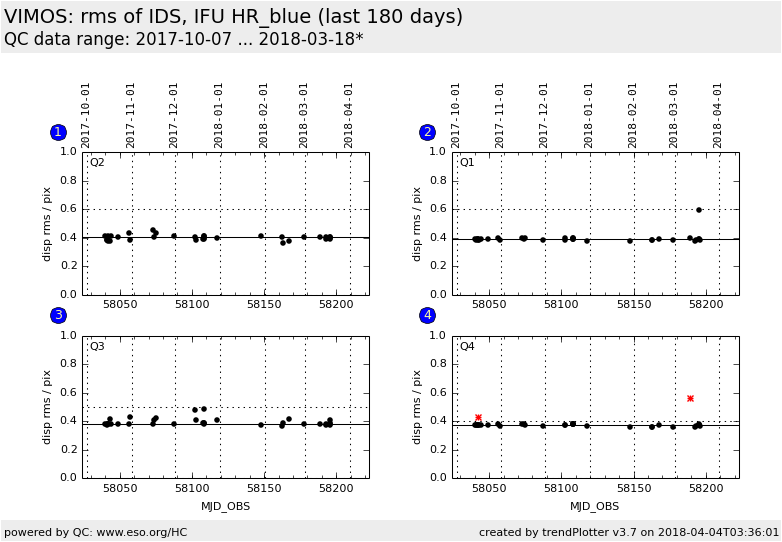
Trending plot for the rms of the dispersion solution for IFU calibrations.
The values should show a stable trend without sudden outliers. Since the
dispersion solution is usually very stable, any values above 0.3 to 0.5 pixels
(depending on the setting) are a concern.
Since October 2010, values for the
dispersion rms vary for Q3 and Q4 because of variable flux from the He and Ne
lamps.
There are occasional pipeline failures in Q2 for daily Health Check
calibrations of IFU LR_red; these give an artificially
high value for the RMS of the dispersion solution.
Settings HR_orange and LR_red are usually measured daily; other settings only when science frames have been observed.
Template ID: ifu_cal_DayCalib (daytime Health Checks), ifu_cal_NightCalib
(attached night-time). Pipeline recipe: vmifucalib.
General information
Click on any of the plots to see a close-up version.
The latest date is indicated on top of the plot.
If configured,
- data points belonging to the latest date are specially marked
- statistical averages are indicated by a solid line, and thresholds by broken lines
- outliers are marked by a red asterisk. They are defined as data points outside the
threshold lines
- "aliens" (= data points outside the plot Y limits) are marked by a red arrow (↑ or ↓)
- you can download the data for each parameter set if the 'Data downloads' link shows up
|
