Quality Control and
Data Processing
|
VISIR: Dark exposures
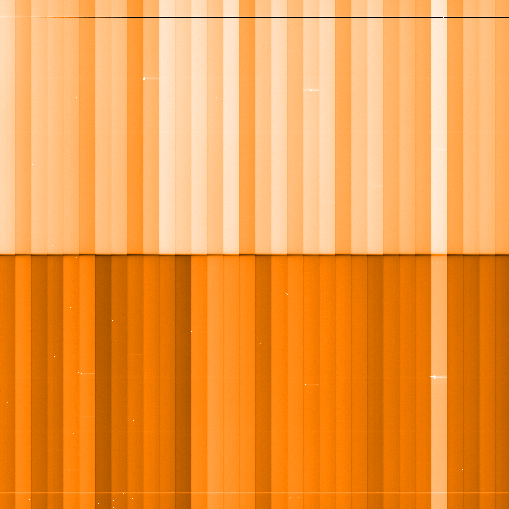
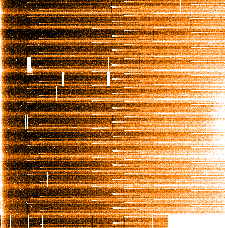
One set of DARK frames for the imaging and one for the spectroscopic detector is taken every day during daytime. Each set consists of 10 raw frames and is always obtained with the same instrument setup: detector integration time DET.SEQ1.DIT=0.02s and number of detector sub-integrations DET.NDIT=1000. DARK frames are not used for calibrating science data but are utilized to monitor performance of the VISIR detectors.
 Read-out noise
The first dark frame of a stack is sometimes contaminated by transient features that artificially increase the background level and therefore the RON calculation. These features are usually less present in the second and third frames. Therefore, the ron2 parameter (see below) is more stable and is used for trending. Scoring&thresholds Read-out noise Scoring thresholds have been set rather losely to 10..20 ADUs due to the uncertainties of the measuring process. April 2015: start of operations after upgrade with new detectors. Read-out noise is calculated from the difference image of the 2nd - 1st raw frame (for ron1) or of the 3rd - 2nd raw frame (for ron2). It is the median of the standard deviations measured from 100 4x4 windows on the difference frame, multiplied by sqrt(NDIT/2).
Dark level
The median dark is trended separately for both the imaging and the spectroscopic detector. Scoring thresholds have been set empirically. April 2015: start of operations after upgrade with new detectors. The median dark level is calculated in the central part of the master dark.
Detector temperature
The detector temperature is trended separately for both the imaging and the spectroscopic detector. Scoring&thresholds Detector temperature Scoring thresholds have been set according to the operational values for the detector temperature.
2010-05-12: the temperature of the imaging detector is read from keyword
INS.TEMP30.VAL and of the spectroscopic detector from keyword INS.TEMP31.VAL.
Before that date different keywords were used: INS.SENS30.VAL and
INS.SENS31.VAL, respectively. The names of the QC1 database columns remained
unchanged. Algorithm Detector temperature Values as recorded in the header keys INS.TEMP30.VAL and INS.TEMP31.VAL.
|
||||||||||||||||||||||||||||||||||||||||||||||||||||||||||||||||||||||||||||||||||||||||||||||||||||||||||||||||||||||||||||||||||||||||||||||||||||||||||||||||||||||||||||||||||||||||||||||||||||||||||||||||||||||||||||||||||||||||||||||||||||||||||||||||||||||||||||||||||||||||||||||||||||||||||||||||||||||||||||||||||||||||||||||||||||||||||||||||||||||||||||||||||||||||||||||||||||||||||||||||||||||||||||||||||||||||||||||||||||||||||||||||||||||||||||||||||||||||||||||||||||||||||||||||||||||||||||||||
| |
|||||||||||||||||||||||||||||||||||||||||||||||||||||||||||||||||||||||||||||||||||||||||||||||||||||||||||||||||||||||||||||||||||||||||||||||||||||||||||||||||||||||||||||||||||||||||||||||||||||||||||||||||||||||||||||||||||||||||||||||||||||||||||||||||||||||||||||||||||||||||||||||||||||||||||||||||||||||||||||||||||||||||||||||||||||||||||||||||||||||||||||||||||||||||||||||||||||||||||||||||||||||||||||||||||||||||||||||||||||||||||||||||||||||||||||||||||||||||||||||||||||||||||||||||||||||||||||||||
 |
|
||||||||||||||||||||||||||||||||||||||||||||||||||||||||||||||||||||||||||||||||||||||||||||||||||||||||||||||||||||||||||||||||||||||||||||||||||||||||||||||||||||||||||||||||||||||||||||||||||||||||||||||||||||||||||||||||||||||||||||||||||||||||||||||||||||||||||||||||||||||||||||||||||||||||||||||||||||||||||||||||||||||||||||||||||||||||||||||||||||||||||||||||||||||||||||||||||||||||||||||||||||||||||||||||||||||||||||||||||||||||||||||||||||||||||||||||||||||||||||||||||||||||||||||||||||||||||||||||