VISIR: Imaging standard stars
| |
| HC PLOTS |
| Sensitivity |
 |
| Conversion factor |
|
| Background |
|
| Image quality |
|
|
QC1 database (advanced users):
browse |
plot
|
VISIR imaging standard stars are observed during night in order to monitor
changes of the MIR observing conditions and to provide photometric flux
calibration. The calibration plan requires the imaging standard stars to be
taken within +/- 3 hours from the science imaging frames.
 |
Imaging Standard Star frame. An example observation of an imaging standard star with the post-upgrade detector. The integrated frame of all half-cycle frames at the first nodding position is shown. Note that the actual field of view is smaller than the detector size.
|
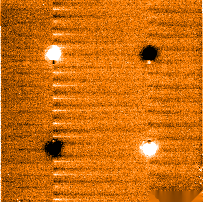 |
Imaging Standard Star frame (pre-upgrade). This is an example pipeline product from an imaging standard star observation. Note persistent horizontal stripes characteristic for the pre-upgrade detector.
|
 Sensitivity
QC1_parameters
| FITS key |
QC1 database: table, name |
definition |
class* |
HC_plot** |
more docu |
| QC.SENSIT | visir_zp_img..sensit | sensitivity (mJy/10sigma/1hr) | HC | | [docuSys coming] |
*Class: KPI - instrument performance; HC - instrument health; CAL - calibration quality; ENG - engineering parameter
**There might be more than one. |
Trending
Sensitivity is trended for a number of N band and Q band filters.
Scoring&thresholds Sensitivity
Scoring is not implemented.
History
| Date |
event |
| until May 2012 | pre-upgrade sensitivities were trended for both small-field (SF) and intermediate-field (IF) pixel field of view |
| since April 2015 | start of operations after upgrade; new detectors, only SF pixel field of view is offered |
Algorithm Sensitivity
Sensitivity is the estimated limiting flux expected in an 1 hour on-source integration of a point source detected with S/N of 10. Units: mJy at 10 sigma in 1hr.
Conversion factor
QC1_parameters
| FITS key |
QC1 database: table, name |
definition |
class* |
HC_plot** |
more docu |
| QC.CONVER | visir_zp_img..conver | conversion factor (ADU/Jy) | HC | | [docuSys coming] |
*Class: KPI - instrument performance; HC - instrument health; CAL - calibration quality; ENG - engineering parameter
**There might be more than one. |
Trending
The conversion factor is trended for a number of N band and Q band filters.
Scoring&thresholds Conversion factor
Scoring is not implemented.
History
| Date |
event |
| until May 2012 | pre-upgrade conversion factor trended for both small-field (SF) and intermediate-field (IF) pixel field of view |
| since April 2015 | start of operations after upgrade; new detectors, only SF pixel field of view is offered |
Algorithm Conversion factor
Conversion between ADU and Jy: F(total oberved) / F(model) [ADU/Jy], where
F(total observed) is the measured and F(model) is the predicted flux for the
standard star from a catalog.
Background
QC1_parameters
| FITS key |
QC1 database: table, name |
definition |
class* |
HC_plot** |
more docu |
| BACKGD.MEAN | visir_zp_img..backgd_mean | estimated mean of the background | HC | | [docuSys coming] |
*Class: KPI - instrument performance; HC - instrument health; CAL - calibration quality; ENG - engineering parameter
**There might be more than one. |
Trending
Background is trended for a number of N band and Q band filters.
Scoring&thresholds Background
Scoring is not implemented.
History
| Date |
event |
| until May 2012 | pre-upgrade background level were trended for both small-field (SF) and intermediate-field (IF) pixel field of view |
| April 2015 | start of operations after upgrade; background level not determined and trended |
| August 2015 | trending of background level resumed |
Algorithm Background
The mean background level is measured from the half-cycle frames (in ADU).
Image quality
QC1_parameters
| FITS key |
QC1 database: table, name |
definition |
class* |
HC_plot** |
more docu |
| QC.FWHMX | visir_zp_img..fwhmx | FWHM in x | HC | | [docuSys coming] |
| QC.FWHMY | visir_zp_img..fwhmy | FWHM in y | HC | | [docuSys coming] |
| QC.GAUSSFIT.FWHM_MAX | visir_zp_img..gauss_fwhm_max | max FWHM from Gauss fit to source | HC | | [docuSys coming] |
| QC.GAUSSFIT.FWHM_MIN | visir_zp_img..gauss_fwhm_min | min FWHM from Gauss fit to source | HC | | [docuSys coming] |
*Class: KPI - instrument performance; HC - instrument health; CAL - calibration quality; ENG - engineering parameter
**There might be more than one. |
Trending
Image quality is trended for N and Q band filters.
Scoring&thresholds Image quality
Scoring is not implemented.
History
| Date |
event |
| April 2015 | start of operations after upgrade; trending of fwhmx and fwhmy introduced |
| February 2016 | Gaussian fit is introduced |
Algorithm Image quality
fwhmx, fwhmy: FWHM of the fitted profile in X and Y direction, measured in pixels and converted to arc seconds for trending
gauss_ fwhm_min, gauss_fwhm_max: FWHM (minimum and maximum) from a 2D Gaussian fit to the star image, more reliable than the FWHM in X or Y direction
|
