Plot
? |
Symb
? |
Source
* |
Average ? |
Thresholds ? |
N_
data |
QC1
parameter |
Data
downloads |
Remarks |
| method |
value |
unit |
method |
value |
| 1 |
• | QC1DB |
MEDIAN |
|
NONE |
VAL | 40000,50000 |
0 |
dark_nbad |
this |
last_yr |
all
|
DARK_nbad, wlen_id=J1228, dit=3.0, CHIP1 |
| 2 |
• | QC1DB |
MEDIAN |
|
NONE |
VAL | 49000,59000 |
0 |
dark_nbad |
this |
last_yr |
all
|
DARK_nbad, wlen_id=J1228, dit=3.0, CHIP2 |
| 3 |
• | QC1DB |
MEDIAN |
|
NONE |
VAL | 75000,85000 |
0 |
dark_nbad |
this |
last_yr |
all
|
DARK_nbad, wlen_id=J1228, dit=3.0, CHIP3 |
| 4 |
• | QC1DB |
MEDIAN |
35 |
K |
VAL | 34.95,35.05 |
761 |
det_temp |
this |
last_yr |
all
|
detector temperature, INS.TEMP29.VAL |
| 5 |
• | QC1DB |
MEDIAN |
6.73e+04 |
NONE |
VAL | 62000,72000 |
57 |
dark_nbad |
this |
last_yr |
all
|
DARK_nbad, wlen_id=J1228, dit=90.0, CHIP1 |
| 6 |
• | QC1DB |
MEDIAN |
8.22e+04 |
NONE |
VAL | 77000,87000 |
57 |
dark_nbad |
this |
last_yr |
all
|
DARK_nbad, wlen_id=J1228, dit=90.0, CHIP2 |
| 7 |
• | QC1DB |
MEDIAN |
1.19e+05 |
NONE |
VAL | 114000,124000 |
57 |
dark_nbad |
this |
last_yr |
all
|
DARK_nbad, wlen_id=J1228, dit=90.0, CHIP3 |
| |
|
*Data sources: QC1DB: QC1 database; LOCAL: local data source
|
Plot 1
scores:  8| 8|
| | data source: | criresp_dark
(QC1 database) |
| dataset: | dark_nbad | • |
| median: | no data | NONE |
| fixed thresholds: | 40000...50000 | NONE |
| N_data plotted: | 0 |
| [click plot for closeup] |
Plot 2
scores: 8|
| | data source: | criresp_dark
(QC1 database) |
| dataset: | dark_nbad | • |
| median: | no data | NONE |
| fixed thresholds: | 49000...59000 | NONE |
| N_data plotted: | 0 |
| [click plot for closeup] |
Plot 3
scores: 8|
| | data source: | criresp_dark
(QC1 database) |
| dataset: | dark_nbad | • |
| median: | no data | NONE |
| fixed thresholds: | 75000...85000 | NONE |
| N_data plotted: | 0 |
| [click plot for closeup] |
Plot 5
scores: 4|
| | data source: | criresp_dark
(QC1 database) |
| dataset: | dark_nbad | • |
| median: | 6.73e+04 | NONE |
| fixed thresholds: | 62000...72000 | NONE |
| N_data plotted: | 57 |
| [click plot for closeup] |
Plot 6
scores: 4|
| | data source: | criresp_dark
(QC1 database) |
| dataset: | dark_nbad | • |
| median: | 8.22e+04 | NONE |
| fixed thresholds: | 77000...87000 | NONE |
| N_data plotted: | 57 |
| [click plot for closeup] |
Plot 7
scores: 4|
| | data source: | criresp_dark
(QC1 database) |
| dataset: | dark_nbad | • |
| median: | 1.19e+05 | NONE |
| fixed thresholds: | 114000...124000 | NONE |
| N_data plotted: | 57 |
| [click plot for closeup] |
Plot 4
scores: no current data
| | data source: | criresp_dark
(QC1 database) |
| dataset: | det_temp | • |
| median: | 35 | K |
| fixed thresholds: | 34.95...35.05 | K |
| N_data plotted: | 761 |
| [click plot for closeup] |
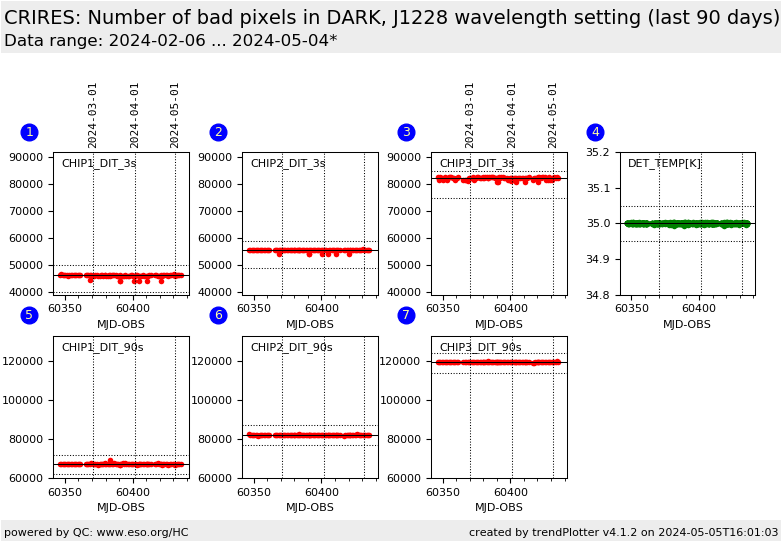
Trending plot for the number of bad pixels in the CRIRES master DARK
calibrations taken in the J1228 wavelength setting, for each of the
detectors.
The number of bad pixels in the darks INS.WLEN.ID=J1228, short
DET.DIT=3.0s (2.0s until 2023-04-05) are shown in the upper
sub-plots, and for the long DET.DIT=90.0s in the lower sub-plots.
Sub-plot number 4 shows detectors' temperature, read from the
INS.TEMP29.VAL keyword.
General information
Click on any of the plots to see a close-up version.
The latest date is indicated on top of the plot.
If configured,
- data points belonging to the latest date are specially marked
- statistical averages are indicated by a solid line, and thresholds by broken lines
- outliers are marked by a red asterisk. They are defined as data points outside the
threshold lines
- "aliens" (= data points outside the plot Y limits) are marked by a red arrow (↑ or ↓)
- you can download the data for each parameter set if the 'Data downloads' link shows up
|
