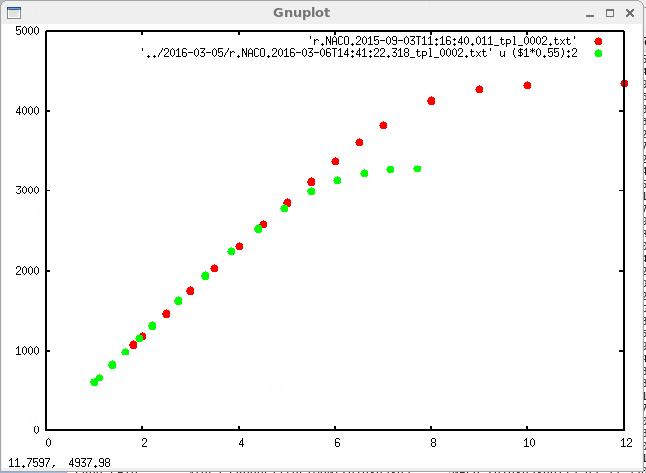
The detector is operated in four different read modes (see DARK QC tutorial ). In late 2015, the full well depth of the fowler sampling read mode decreased.
This plot shows the median counts in imaging flats as dependent on the exposure time (DIT) acquired with the detmon template. The read mode is FowlerNsamp. The DIT values of the sequence from 2016-03 have been scaled by 0.55, that the linear part of the detector response matches in both calibration sequences. The sequence acquired in 2015-09 (red) saturates at ~ 4300 ADU, while the sequence from 2016-03 (green) saturates at ~3400 ADU.
The same issue happened again in 2016-11 with a smaller change.
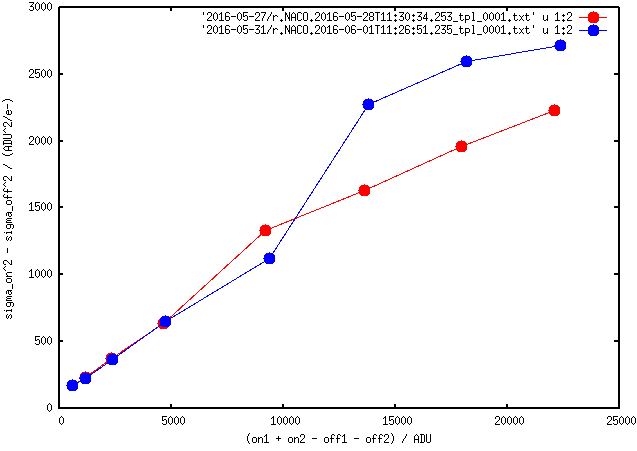
On 2016-06-03 statistical noise as read from flat difference frames changed its relation to the exposure time (or to the flux level). The noise became larger for larger DIT resulting in a steeper photon transfer curve and a lower gain. For Uncorr HighWellDepth read mode the gain reduced from 10 e-/ADU to 7.5 e-/ADU.
This Figure shows the photon transfer curve for the Uncorr HighWellDepth read mode from and of May 2016 (red) with a derived gain value of ~10 e-/ADU and from early June 2016 (blue) with a derived gain value of ~7.5 e-/ADU.
Since 2015:
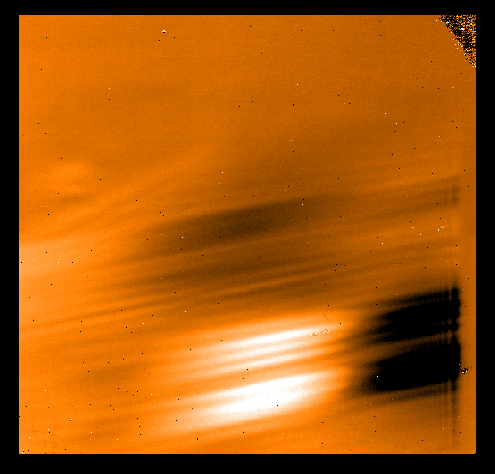
The lower part of the detector, in particular the lower left quadrant suffers from a skewed large scale light leakage, visible in long exposure (large DIT) darks frames, in lamp flats, in twilight flats and in science images. The pattern changes as soon as the camera wheel (with S13, S27, S54 ...) moves in and out. Therefore the position of the contamination is not reproducible. As the erratic light is additive, the instrumental feature cannot be calibrated via flat fielding.
The JHK band NACO calibration plan foresees close in time lamp flats to calibrate science observations. Twilight flats, as technical calibration, are used to cross check against lamp flats to justify the usage of lamp flat for the science. Since neither lamp flats nor twilight flats are able to calibrate the lower part of the NACO detector, the calibration scheme is currently confined to the upper part of the detector.
This figure shows the ratio between a S13 Ks lamp flat and a twilight flat, acquired a few hours apart in 2016.
top detector cross talk, persistence, optical ghosts
For bright sources (e.g. The fiber image of the daily AO HC test, photometric standard stars and bright objects in science observations) three effects have been identified so far:
We found an optical ghost in heavily saturated science images, about 200 pixel to the right of the saturated source. The optical ghost shows up always at the same position on the sky, coadding a science jitter sequence coadds the ghost as well, meaning is does not smear out and does not contaminate other regions of the FOV.
We found persistence in the consecutive science frame at the position, where there was a heavily saturated source in the precursor frame. In coadded science products acquired with the jitter template, each raw frame (except the first of the sequence is) contaminated.
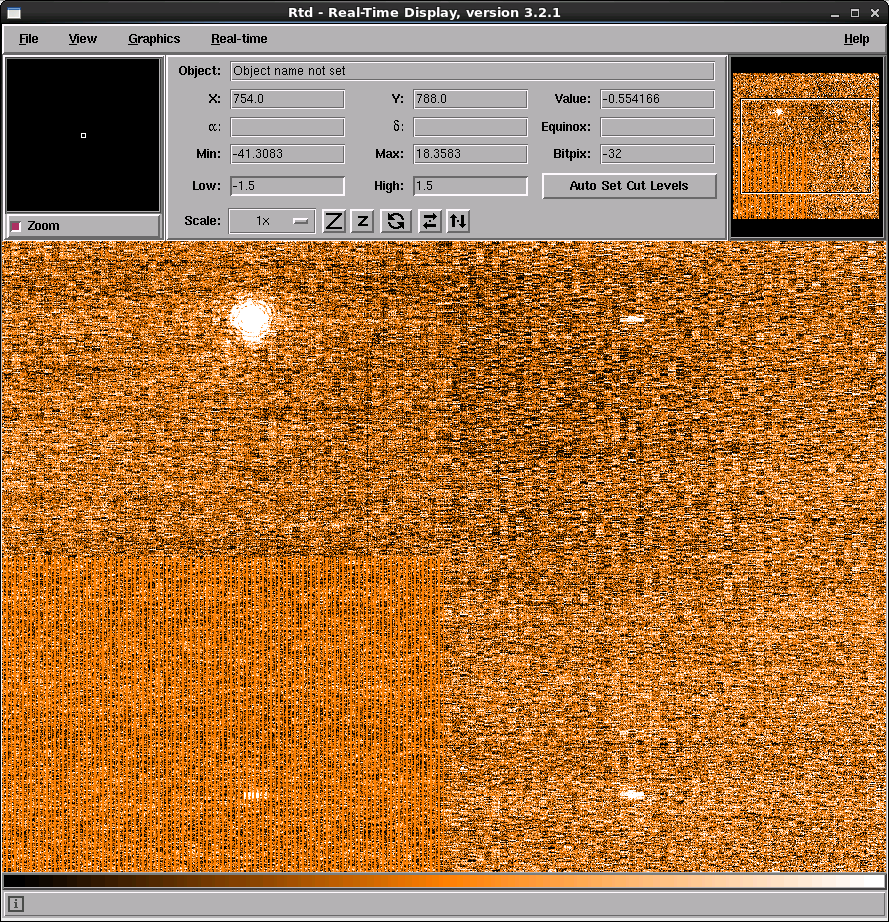
We found detector cross talk in science images with bright sources, in photometric standard star calibrations and in fiber image of the AO check. The up to three cross-talk images show up mirror-reversed in the neighbouring detector quadrants. Together with the bright source they build the corners of a rectangle.
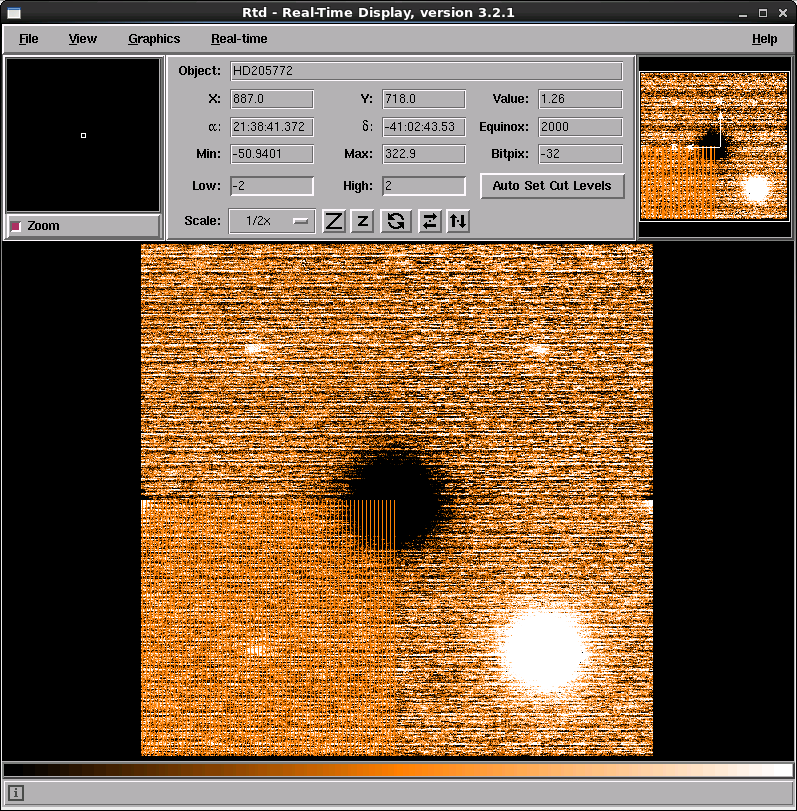
Fig: Left: dark subtracted AO check health check frame. The fiber image in the UL quadrant shows three faint detector cross talk images in the other three quadrants.
Right: difference image of two consecutive photometric standard star calibration observations (Ks, S13). The bright source in the LR quadrant shows three cross-talk images at mirror-reversed positions in the other three detectors. (while the detector has 1024x2014 pixel, each bright source is mirrored at the two axis x=512 pixel and y=512 pixel). The detector cross talk images of the subtracted image with the (black) source in the centre are projected on the star itself, being close to pixel 512,512.
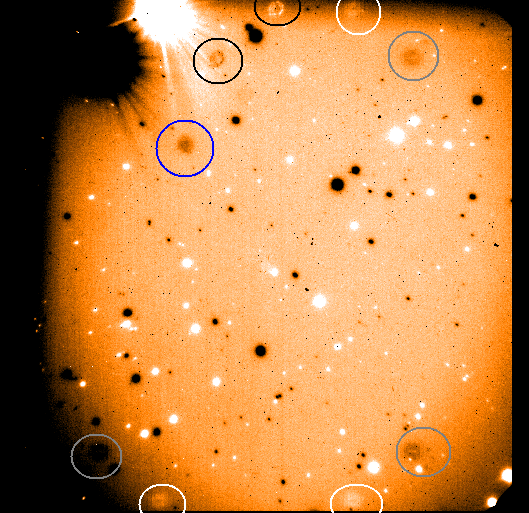
Fig: Science difference image (H, S54) contaminated by a very saturated source in the UL detector quadrant. The optical ghosts located ~200 pixel to the right of the source are marked by two black circles. A persistence, coming from a previous observation of the sequence is marked by a blue circle. The three detector cross-talk images of the positive image are marked by white circles. The three detector cross talk images coming from the negative image are marked by gray circles. Note that the left part of the S54 suffers from an instrumental vignetting.