Quality Control and
Data Processing
|
NACO: Detector monitoring
The NACO detmon template acquires a series of flat field pairs and corresponding dark frames in order to retrieve the detector gain and detector non-linearity. Up to 2016 the following four read modes are monitored:
Notes on the history Data acquired in 2015 are based on a new detector, for which the template is not optimized. 2015 detmon data are less useful. In 2016-01 Double_RdRstRd_HighSensitivity is replaced by Uncorr_HighDynamic, and the monitoring is restarted again. Since the detector suffers since 2015-01 from a dead column effect in the lower left quadrant, only the upper right detector quadrant is used for the detmon analysis. Furthermore it turned out (for the period 2015 up to 2016-01) that flats with DIT=3sec and Uncorr mode show additional fixed pattern noise which biases the photon transfer curve when retrieving the gain. These DIT=3sec flats are ignored when processing detmon frames in Uncorr read mode. Status since 2016-05-01 The following read modes are monitored, values are for the upper right 512x512 pixel detector quadrant:
Status 2017-07: The detector controller was reconfigured, that the saturation level of the Fowler sampling read mode is again at 4000 ADU.
2018-11-07: Two sequences with DET.NCORRS.NAME=Uncorr and DET.MODE.NAME=HighBackground have been
acquired once. This is the read mode used for M-band imaging only. The following QC1 parameters were retrieved:
 Saturation level
In optical CCDs there is a fixed saturation level of 65335 ADU (= 2^(16)-1) and the small non-linear component of the response can be described by a polynomial in the count range of up the discontinuity at 65335 ADU. In IR detectors the non-linearity is stronger, starts at lower counts and the saturation level is reached more smoothly when compared to CCDs. The detmon pipeline recipe is configured to use for each of the four monitored read modes an optimized set of recipe parameters. These command line parameter sets are tuned to retrieve the gain and the non-linearity but not the saturation level. Since in 2015-10 the saturation level changed in one of the read modes, the following procedure was implemented to monitor the saturation level (see the magenta points here): The median values of the raw flat frames is fit by the following function:
|
||||||||||||||||||||||||||||||||||||||||||||||||||||||||||||||||||||||||||||||||||||||||||||||||||||||||||||||||||||||||||||||||||||||||||||||||||||||||||||||||||||||||||||||||||||||||||||||||||||||||||||||||||||||||||||||||||||||||||||||||||||||||||||||||||||||||||||||||||||||||||||||||||||||||||||||||||||||||||||||||||||||||||||||||||||||||||||||||||||||||||||||||||||||||||||||||||||||||||||||||||||||||||||||||||||||||||||||||||||||||||||||||||||||||||||||||||||||||||||||||||||||||||||||||||||||||||||||||||||||||||||||||||||||||||||||||||||||||||||||||||||||||||||||||||||||||||||||||||||||||||||
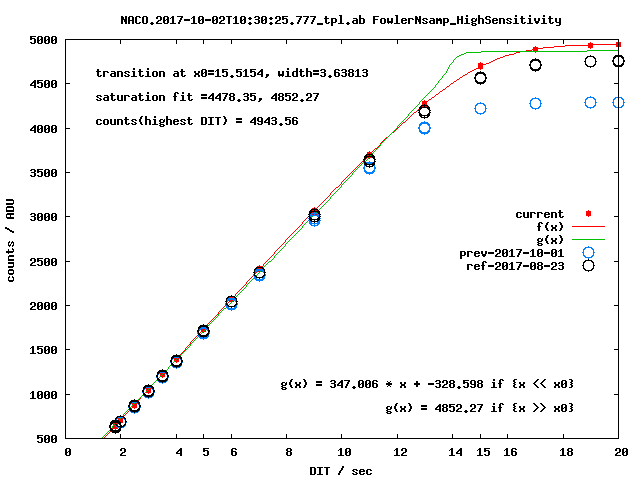 |
The median values versus DIT have been fit two times, once (green f(x) ) with a free width and a second time (blue g(x) ) where x0 is fixed from f(x) and the width s is fixed to a 5 times smaller value of f(x), which results in a more stable values of c. |
| FITS key | QC1 database: table, name | definition | class* | HC_plot** | more docu | |||||||||||||||||||||||||||||||||||||||||||||||||||||||||||||||||||||||||||||||||||||||||||||
| [derived from QC procedure] | naco_detmon..brightest_counts | counts in brighest flat generated by template | HC | | [docuSys coming] | |||||||||||||||||||||||||||||||||||||||||||||||||||||||||||||||||||||||||||||||||||||||||||||
| [derived from QC procedure] | naco_detmon..max_count | maximum counts used for linearity estimate | HC | | [docuSys coming] | |||||||||||||||||||||||||||||||||||||||||||||||||||||||||||||||||||||||||||||||||||||||||||||
| [derived from QC procedure] | naco_detmon..fit_c0 | fit: saturation in ADU | HC | | [docuSys coming] | |||||||||||||||||||||||||||||||||||||||||||||||||||||||||||||||||||||||||||||||||||||||||||||
| *Class: KPI - instrument performance; HC - instrument health; CAL - calibration quality; ENG - engineering parameter **There might be more than one. | ||||||||||||||||||||||||||||||||||||||||||||||||||||||||||||||||||||||||||||||||||||||||||||||||||
The trending plot covers the three parameters explained above, to check that a) the frame sequence covers the saturation level, b) the recipe is configured to cover the saturation lavel and that c) the saturation level of the detector is stable (it was not in 2016).
Scoring&thresholds Saturation level
The values are not scored
| Date | event |
| 2015-01 | start of monitoring |
| 2015 | In late 2015, the full well depth of the Fowler sampling read mode decreased, see Fig. History1 |
| 2016-03 | detmon template fine-tuned |
| 2017-07 | detector full well depth reconfigured for Fowler sampling |
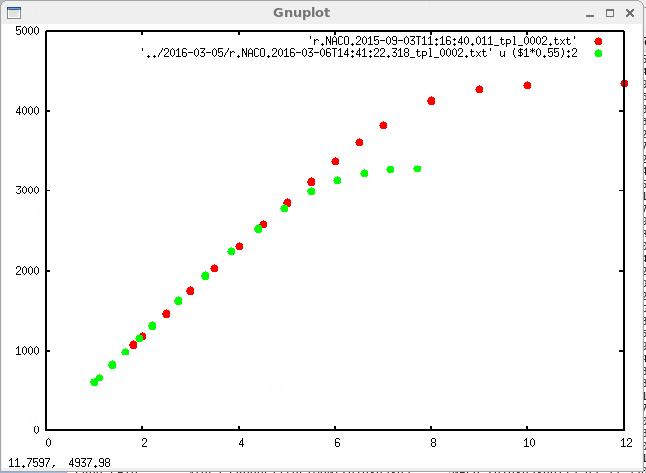 |
History1: This plot shows the median counts in imaging flats as dependent on the exposure time (DIT) acquired with the detmon template. The read mode is FowlerNsamp. The DIT values of the sequence from 2016-03 have been scaled by 0.55, that the linear part of the detector response matches in both calibration sequences. The sequence acquired in 2015-09 (red) saturates at ~ 4300 ADU, while the sequence from 2016-03 (green) saturates at ~3400 ADU. The same issue happened again in 2016-11 with a smaller change. |
The counts are directly read from the raw frames.
Linearity
| Saturation level | Linearity | Gain |
The non-linearity of the detector response is calculated by the detmon recipe. A higher order polynomial is fit to the dark subtracted flat frame median as a function of DIT. See:
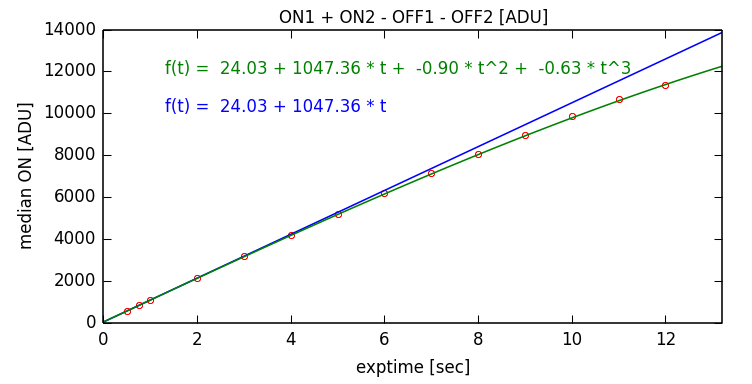 |
This figure shows an extraction of the larger QC report. The third order polynomial fit (green) and a corresponding linear component is shown. The QC parameter returned from the recipe is the deviation from linearity at a reference level of 8000 ADU (for Double_RdRstRd_HighDynamic). |
Dividing the green line by the blue line and expressing DIT by ADU, the deviation from linearity is shown:
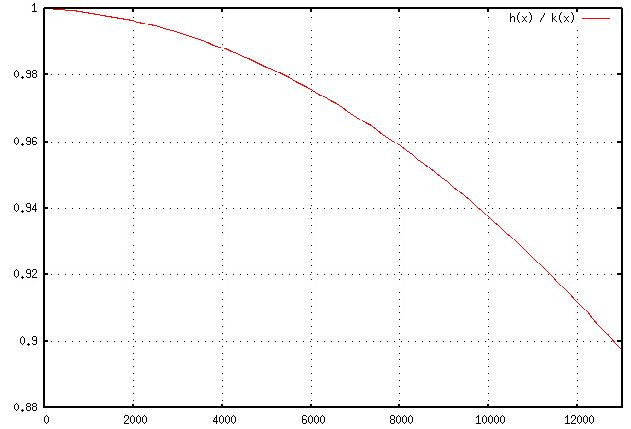 |
The figure shows that in 2016-05, the relative deviation from non-linearity at R=8000 ADU is about 0.04, which is monitored as QC parameter in this HC plot. The non-linearity is a function of count level. |
| FITS key | QC1 database: table, name | definition | class* | HC_plot** | more docu | |||||||||||||||||||||||||||||||||||||||||||||||||||||||||||||||||||||||||||||||||||||||||||||
| QC.LIN_EFF | naco_detmon..non_linear | non-linearity at reference flux level | HC | | [docuSys coming] | |||||||||||||||||||||||||||||||||||||||||||||||||||||||||||||||||||||||||||||||||||||||||||||
| *Class: KPI - instrument performance; HC - instrument health; CAL - calibration quality; ENG - engineering parameter **There might be more than one. | ||||||||||||||||||||||||||||||||||||||||||||||||||||||||||||||||||||||||||||||||||||||||||||||||||
See gain
This parameter is not scored.
See gain
Details are given in the detector monitoring pipeline user manual.
Gain
| Saturation level | Linearity | Gain |
The detector gain value is calculated by the detmon recipe, where a counts threshold for excluding bright flats is applied in order confine the analysis (the photon transfer curve method is used) to the linear part of the detector response. The following figure shows an extraction of the QC report.
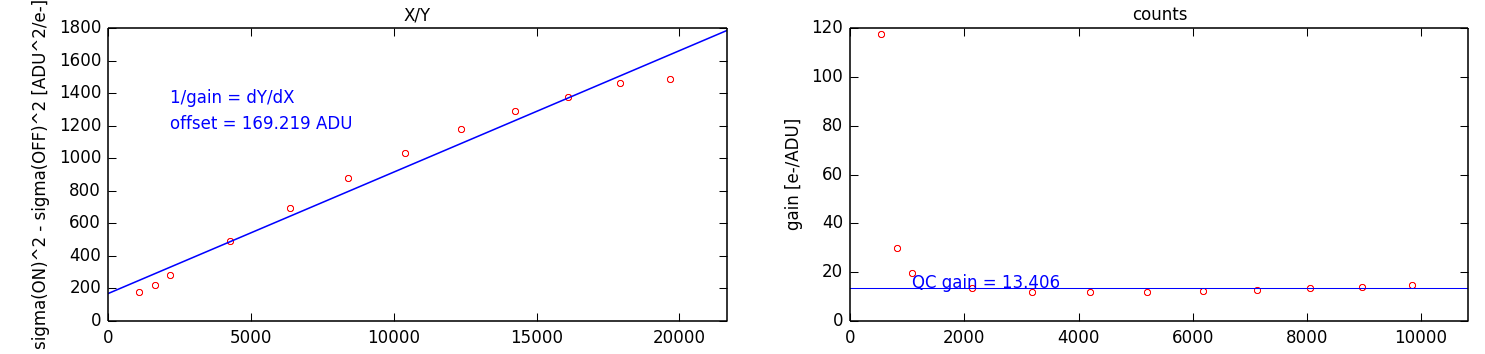 |
The left box shows the variance of the flat frames (minus the variance of the off-lamp frames) as a function of twice the dark subtracted flat counts. The inverse of the best fit linear function slope is the gain, which corresponds in this case to 13.4 e-/ADU. The right figure shows the gain values for each DIT, where two flats and two dark frames have been used (red circles). For comparison, the gain retrieved from the left figure is plot (blue line). |
Note: The variances show a slight non-linear behavior. A non-linear fit would result in lower gain results (steeper slope) for low counts and higher gain values for the less steep high count range. The offset of 169 ADU is a known unreliable linear extrapolation of the photon transfer curve and is meaningless.
| FITS key | QC1 database: table, name | definition | class* | HC_plot** | more docu | |||||||||||||||||||||||||||||||||||||||||||||||||||||||||||||||||||||||||||||||||||||||||||||
| QC.GAIN | naco_detmon..gain | gain (e-/ADU) | HC | | [docuSys coming] | |||||||||||||||||||||||||||||||||||||||||||||||||||||||||||||||||||||||||||||||||||||||||||||
| *Class: KPI - instrument performance; HC - instrument health; CAL - calibration quality; ENG - engineering parameter **There might be more than one. | ||||||||||||||||||||||||||||||||||||||||||||||||||||||||||||||||||||||||||||||||||||||||||||||||||
The Gain s derived from the detmon recipe is monitored for four detector setups.
The gain is scored. The thresholds have been set such, that data contamination by sporadic events of the 8-column noise in the upper right quadrant exceed the thresholds and give a red score.
| Date | event |
| 2015-01 | The detector is exchanged. The newly installed detector is the Aladdin detector formerly used by ISAAC LW-arm. It is mounted in NACO by 90deg rotated with respect to ISAAC and it is operated with the NACO read modes. |
| 2015-07 | The upper right quadrant is subject to a pattern where every 8th column is dead. |
| 2015-10 | The saturation level of the Fowler sampling read mode changed from 4300 ADU to ~3400 ADU. |
| 2015-12 | The upper right quadrant is ok, but the lower left quadrant is subject of a pattern where every 8th column is dead. |
| 2016-06 | The statistical noise of the two Uncorr read modes increased for larger DIT, resulting in a reduced gain value ( 25% less ), see Fig. History2. |
| 2016-11 | The saturation level (full well depth) becomes smaller in Fowler sampling mode and partially in Double ResetReadRead mode. |
| 2017-07 | The detector controller was reconfigured, that the saturation level of the Fowler sampling read mode is again at 4000 ADU. |
| 2017-09 | From time to time (in single nights), the saturation level is found to be lower by several hundreds of ADU for the Double and Fowler read modes |
| 2018-02 | It can happen from time to time that the flats acquired with DIT=2sec are contaminated by statistical noise of unknown origin. In this case the flat pair is discarded from the sequence, the event is documented and the shortened data set is reprocessed to monitor the gain and non-linearity. |
| 2018-05-15_and_2018-04-26_and_2018-03-28 | The flat difference frames show 8-column noise in the UR quadrant, contaminating the statistical noise and hence the gain calculation. Gain thresholds set to +- 2 e-/ADU, to become sensitive to stripe pattern in upper right detector quadrant. |
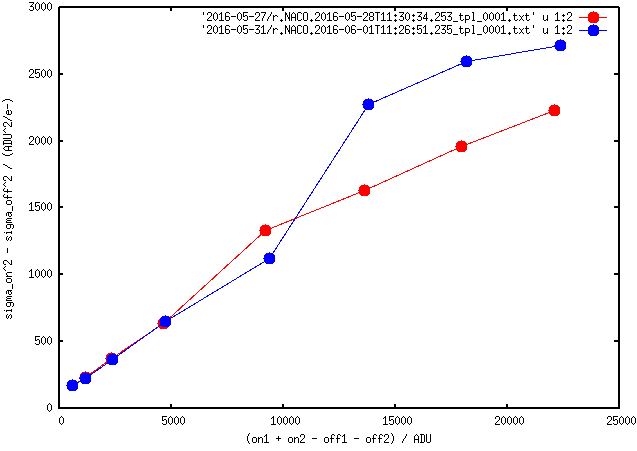 |
History2: On 2016-06-03 statistical noise as read from flat difference frames changed its relation to the exposure time (or to the flux level).
The noise became larger for larger DIT resulting in a steeper photon transfer curve and a lower gain. For Uncorr HighWellDepth read mode the gain reduced from 10 e-/ADU to 7.5 e-/ADU.
This Figure shows the photon transfer curve for the Uncorr HighWellDepth read mode from and of May 2016 (red) with a derived gain value of ~10 e-/ADU and from early June 2016 (blue) with a derived gain value of ~7.5 e-/ADU. |
The photon transfer curve is used. Details are given in the detector monitoring pipeline user manual.

| Send comments to <qc_naco@eso.org> | powered by QC [webCMS v1.0.1] |