Plot
? |
Symb
? |
Source
* |
Average ? |
Thresholds ? |
N_
data |
QC1
parameter |
Data
downloads |
Remarks |
| method |
value |
unit |
method |
value |
| 1 |
• | QC1DB |
MEDIAN |
-0.0076 |
NONE |
none | |
24 |
lineff |
this |
last_yr |
all
|
eff. non-linearity at 40000ADU, Q2, low gain |
| 2 |
• | QC1DB |
MEDIAN |
-0.0048 |
NONE |
none | |
24 |
lineff |
this |
last_yr |
all
|
eff. non-linearity at 40000ADU, Q1, low gain |
| 3 |
• | QC1DB |
MEDIAN |
-0.0024 |
NONE |
none | |
25 |
lineff |
this |
last_yr |
all
|
eff. non-linearity at 40000ADU, Q2, high gain |
| 4 |
• | QC1DB |
MEDIAN |
-0.0019 |
NONE |
none | |
24 |
lineff |
this |
last_yr |
all
|
eff. non-linearity at 40000ADU, Q1, high gain |
| 5 |
• | QC1DB |
MEDIAN |
-0.0039 |
NONE |
none | |
24 |
lineff |
this |
last_yr |
all
|
eff. non-linearity at 40000ADU, Q3, low gain |
| 6 |
• | QC1DB |
MEDIAN |
-0.0055 |
NONE |
none | |
24 |
lineff |
this |
last_yr |
all
|
eff. non-linearity at 40000ADU, Q4, low gain |
| 7 |
• | QC1DB |
MEDIAN |
-0.0018 |
NONE |
none | |
25 |
lineff |
this |
last_yr |
all
|
eff. non-linearity at 40000ADU, Q3, high gain |
| 8 |
• | QC1DB |
MEDIAN |
-0.00325 |
NONE |
none | |
24 |
lineff |
this |
last_yr |
all
|
eff. non-linearity at 40000ADU, Q4, high gain |
| |
|
*Data sources: QC1DB: QC1 database; LOCAL: local data source
|
Plot 1
scores: not implemented
| | data source: | vimos_detmon
(QC1 database) |
| dataset: | lineff | • |
| median: | -0.0076 | NONE |
| thresholds: | none | |
| N_data plotted: | 24 |
| [click plot for closeup] |
Plot 2
scores: not implemented
| | data source: | vimos_detmon
(QC1 database) |
| dataset: | lineff | • |
| median: | -0.0048 | NONE |
| thresholds: | none | |
| N_data plotted: | 24 |
| [click plot for closeup] |
Plot 3
scores: not implemented
| | data source: | vimos_detmon
(QC1 database) |
| dataset: | lineff | • |
| median: | -0.0024 | NONE |
| thresholds: | none | |
| N_data plotted: | 25 |
| [click plot for closeup] |
Plot 4
scores: not implemented
| | data source: | vimos_detmon
(QC1 database) |
| dataset: | lineff | • |
| median: | -0.0019 | NONE |
| thresholds: | none | |
| N_data plotted: | 24 |
| [click plot for closeup] |
Plot 5
scores: not implemented
| | data source: | vimos_detmon
(QC1 database) |
| dataset: | lineff | • |
| median: | -0.0039 | NONE |
| thresholds: | none | |
| N_data plotted: | 24 |
| [click plot for closeup] |
Plot 6
scores: not implemented
| | data source: | vimos_detmon
(QC1 database) |
| dataset: | lineff | • |
| median: | -0.0055 | NONE |
| thresholds: | none | |
| N_data plotted: | 24 |
| [click plot for closeup] |
Plot 7
scores: not implemented
| | data source: | vimos_detmon
(QC1 database) |
| dataset: | lineff | • |
| median: | -0.0018 | NONE |
| thresholds: | none | |
| N_data plotted: | 25 |
| [click plot for closeup] |
Plot 8
scores: not implemented
| | data source: | vimos_detmon
(QC1 database) |
| dataset: | lineff | • |
| median: | -0.00325 | NONE |
| thresholds: | none | |
| N_data plotted: | 24 |
| [click plot for closeup] |
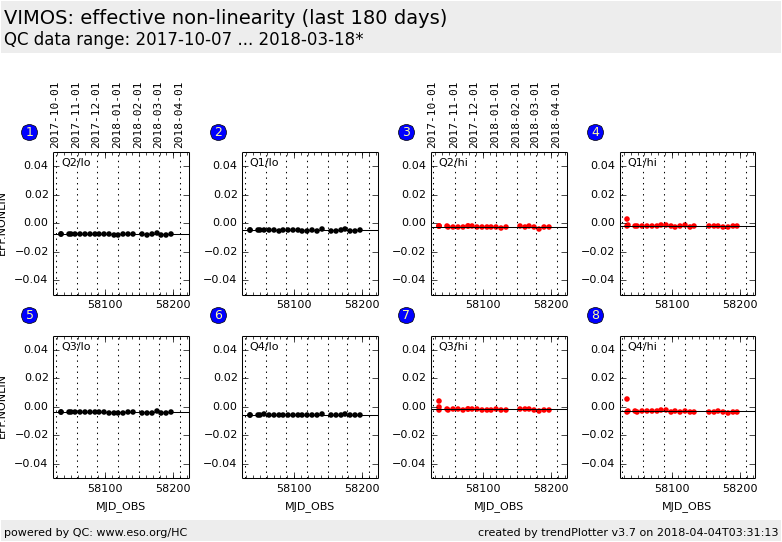
Trending plot for non-linearity measurements of the VIMOS detectors.
Data are taken from detector monitoring calibrations which are series of flat
fields with increasing exposure times. A second order polynomial
is fit to the data (flux vs. exposure time for each pixel).
The trending shows the average effective non-linearity at 40000 ADU.
Effective
non-linearity is the difference between the flux predicted at 40000 ADU by the
linear term and the flux obtained from the polynomial, normalized by
the polynomial flux.
Only the central 1600 x 1800 pixles are used for calculation of detector
monitoring parameters (since 2009-10-09).
The average effective non-linearity should be near zero.
The non-linearity parameter showed strong scatter in 2011 and 2012 due to
stability problems with the flat-fields. The highest flux for the high-gain
read-out mode was also too low until January 2014 so that the non-linearity
at 40000 ADU was not well determined.
Template ID: tec_DetLin. Pipeline recipe: vmdetlin.
General information
Click on any of the plots to see a close-up version.
The latest date is indicated on top of the plot.
If configured,
- data points belonging to the latest date are specially marked
- statistical averages are indicated by a solid line, and thresholds by broken lines
- outliers are marked by a red asterisk. They are defined as data points outside the
threshold lines
- "aliens" (= data points outside the plot Y limits) are marked by a red arrow (↑ or ↓)
- you can download the data for each parameter set if the 'Data downloads' link shows up
|
