Plot
? |
Symb
? |
Source
* |
Average ? |
Thresholds ? |
N_
data |
QC1
parameter |
Data
downloads |
Remarks |
| method |
value |
unit |
method |
value |
| 1 |
• | QC1DB |
MEDIAN |
0.047 |
mag |
VAL | 0,0.15 |
6 |
sigma_zeropoint |
this |
last_yr |
all
|
Q2, standard deviation of night Zp |
| 2 |
• | QC1DB |
MEDIAN |
0.0485 |
mag |
VAL | 0,0.15 |
6 |
sigma_zeropoint |
this |
last_yr |
all
|
Q1, standard deviation of night Zp |
| 3 |
• | QC1DB |
MEDIAN |
0.0535 |
mag |
VAL | 0,0.15 |
6 |
sigma_zeropoint |
this |
last_yr |
all
|
Q3, standard deviation of night Zp |
| 4 |
• | QC1DB |
MEDIAN |
0.0485 |
mag |
VAL | 0,0.15 |
6 |
sigma_zeropoint |
this |
last_yr |
all
|
Q4, standard deviation of night Zp |
| |
|
*Data sources: QC1DB: QC1 database; LOCAL: local data source
|
Plot 1
scores: not implemented
| | data source: | vimos_zp_night
(QC1 database) |
| dataset: | sigma_zeropoint | • |
| median: | 0.047 | mag |
| fixed thresholds: | 0...0.15 | mag |
| N_data plotted: | 6 |
| [click plot for closeup] |
Plot 2
scores: not implemented
| | data source: | vimos_zp_night
(QC1 database) |
| dataset: | sigma_zeropoint | • |
| median: | 0.0485 | mag |
| fixed thresholds: | 0...0.15 | mag |
| N_data plotted: | 6 |
| [click plot for closeup] |
Plot 3
scores: not implemented
| | data source: | vimos_zp_night
(QC1 database) |
| dataset: | sigma_zeropoint | • |
| median: | 0.0535 | mag |
| fixed thresholds: | 0...0.15 | mag |
| N_data plotted: | 6 |
| [click plot for closeup] |
Plot 4
scores: not implemented
| | data source: | vimos_zp_night
(QC1 database) |
| dataset: | sigma_zeropoint | • |
| median: | 0.0485 | mag |
| fixed thresholds: | 0...0.15 | mag |
| N_data plotted: | 6 |
| [click plot for closeup] |
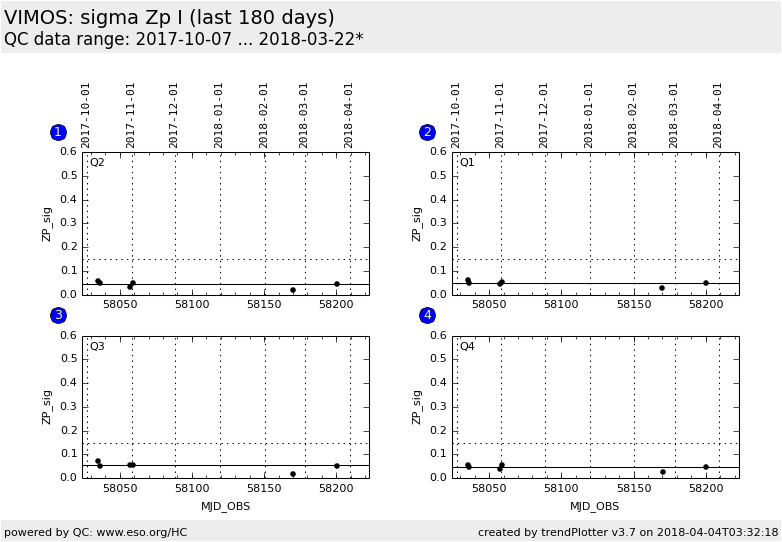
Trending plot for standard deviation of night zeropoints.
The plot shows the standard deviation of the night zeropoints as computed by
QC Garching. High values could indicate that the weather conditions during the
night were variable.
Template ID: img_cal_Photom. Pipeline recipe: vmimcalphot.
General information
Click on any of the plots to see a close-up version.
The latest date is indicated on top of the plot.
If configured,
- data points belonging to the latest date are specially marked
- statistical averages are indicated by a solid line, and thresholds by broken lines
- outliers are marked by a red asterisk. They are defined as data points outside the
threshold lines
- "aliens" (= data points outside the plot Y limits) are marked by a red arrow (↑ or ↓)
- you can download the data for each parameter set if the 'Data downloads' link shows up
|
