mirror sites: PL (internal link) HQ     [?]

Health Check monitor


CAL | HC
HealthCheck Monitor
   HOME | UsersGuide
  sl icon ALL INSTRUMENTS
 
all KPI reports
XSHOOTER:
detector: bias
Other HC:
QC links:
        [page auto-refreshes after 300 sec]   [stop | on]            [press Ctrl+Shift+R to enforce refresh of scores, dates and news]
XSHOOTER trending system: HEALTH CHECK report
HELP USERS-GUIDE MORE
Last update: 2026-07-27T22:35:34 (UT)
  | now: 2026-07-28T04:29:17 (UT) muc02 QC pipeline: xshoo-3.6.5a (installed 2023-09-18)
same group: med_master ron_raw ron_master struct_x struct_y per.pat.noise
General news: NOTE: The Health Check and calChecker services have been moved to qcFlow. These pages are only maintained for comparison and will be removed in 2026.
XSHOOTER news:  
Report news:
DATE*: [?] 2026-07-21
report | NLT
2026-07-22
report | NLT
2026-07-23
report | NLT
2026-07-24
report | NLT
2026-07-25
report | NLT
2026-07-26
report | NLT
2026-07-27
no data | NLT
r...
Raw CAL displays:
raw raw raw raw raw raw no CAL raw files
P...
CAL product quality:
products products products products products products no CAL products
 
transfer   ngas [?]
scores&comments | FULL | history ... | plot tutorial ... | contact | HC_docu... | quality events...                 daily/often; important to check     [?]
*Date on this monitor changes at 21:00 UT
png: Information and research:
- png file - advanced studies: QC1 browser | QC1 plotter
Plot
?
Symb
?
Source
*
Average ? Thresholds ? N_
data
QC1
parameter
Data
downloads
Remarks
method value unit method value
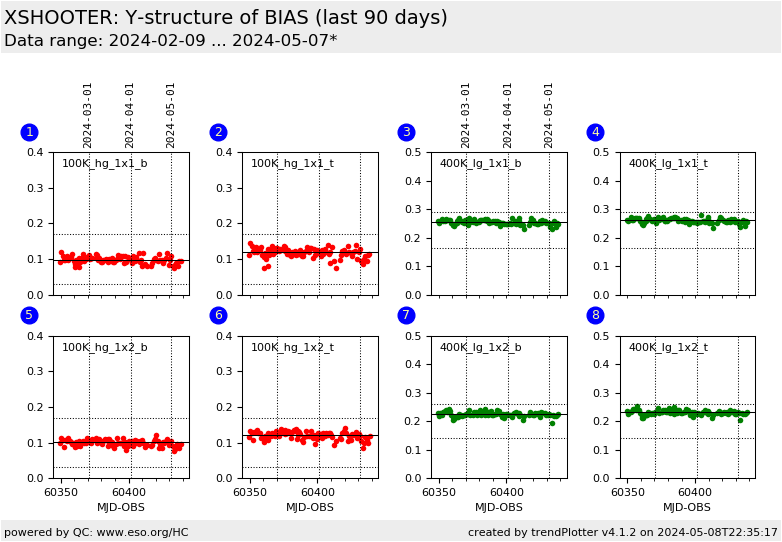
1 QC1DB MEDIAN 0.0887 NONE VAL0.03,0.17 75 struct_y1 this | last_yr | all 100k/1pt/hg (bottom half)
2 QC1DB MEDIAN 0.105 NONE VAL0.03,0.17 75 struct_y2 this | last_yr | all 100k/1pt/hg (top half)
3 QC1DB MEDIAN 0.251 NONE VAL0.165,0.29 75 struct_y1 this | last_yr | all 400k/1pt/lg (bottom half)
4 QC1DB MEDIAN 0.257 NONE VAL0.165,0.29 75 struct_y2 this | last_yr | all 400k/1pt/lg (top half)
5 QC1DB MEDIAN 0.0913 NONE VAL0.03,0.17 75 struct_y1 this | last_yr | all 100k/1pt/hg/1x2 (bottom half)
6 QC1DB MEDIAN 0.11 NONE VAL0.03,0.17 75 struct_y2 this | last_yr | all 100k/1pt/hg/1x2 (top half)
7 QC1DB MEDIAN 0.218 NONE VAL0.14,0.26 75 struct_y1 this | last_yr | all 400k/1pt/lg/1x2 (bottom half)
8 QC1DB MEDIAN 0.225 NONE VAL0.14,0.26 75 struct_y2 this | last_yr | all 400k/1pt/lg/1x2 (top half)
*Data sources: QC1DB: QC1 database; LOCAL: local data source
Plot 1
scores: 7|
data source:xshooter_bias
(QC1 database)
dataset:struct_y1
median:0.0887NONE
fixed thresholds:0.03...0.17NONE
N_data plotted:75
[click plot for closeup]
Plot 2
scores: 7|
data source:xshooter_bias
(QC1 database)
dataset:struct_y2
median:0.105NONE
fixed thresholds:0.03...0.17NONE
N_data plotted:75
[click plot for closeup]
Plot 5
scores: 7|
data source:xshooter_bias
(QC1 database)
dataset:struct_y1
median:0.0913NONE
fixed thresholds:0.03...0.17NONE
N_data plotted:75
[click plot for closeup]
Plot 6
scores: 7|
data source:xshooter_bias
(QC1 database)
dataset:struct_y2
median:0.11NONE
fixed thresholds:0.03...0.17NONE
N_data plotted:75
[click plot for closeup]
Plot 3
scores: 7|
data source:xshooter_bias
(QC1 database)
dataset:struct_y1
median:0.251NONE
fixed thresholds:0.165...0.29NONE
N_data plotted:75
[click plot for closeup]
Plot 4
scores: 7|
data source:xshooter_bias
(QC1 database)
dataset:struct_y2
median:0.257NONE
fixed thresholds:0.165...0.29NONE
N_data plotted:75
[click plot for closeup]
Plot 7
scores: 7|
data source:xshooter_bias
(QC1 database)
dataset:struct_y1
median:0.218NONE
fixed thresholds:0.14...0.26NONE
N_data plotted:75
[click plot for closeup]
Plot 8
scores: 7|
data source:xshooter_bias
(QC1 database)
dataset:struct_y2
median:0.225NONE
fixed thresholds:0.14...0.26NONE
N_data plotted:75
[click plot for closeup]
This plot

To determine the structure along the X/Y-axis the bias is collapsed along the Y/X-axis and the slope of the resulting one-dimensional frame is determined. More information can be found at the plot tutorial page  


General information

Click on any of the plots to see a close-up version.

The latest date is indicated on top of the plot.

If configured,

  • data points belonging to the latest date are specially marked
  • statistical averages are indicated by a solid line, and thresholds by broken lines
  • outliers are marked by a red asterisk. They are defined as data points outside the threshold lines
  • "aliens" (= data points outside the plot Y limits) are marked by a red arrow ( or )
  • you can download the data for each parameter set if the 'Data downloads' link shows up