| This documentation is intended both for QC scientists and SciOps astronomers (who may want to ignore the technical information displayed in grey). | |||||||||||||||||||||||
|
|||||||||||||||||||||||
| bottom plots | contact | |||||||||||||||||||||||
| NAME | run_dettrn.csh | ||||||||||||||||||||||
| VERSION | 1.0 | ||||||||||||||||||||||
| SYNTAX | SHELL | ||||||||||||||||||||||
| CALL |
processQC -a abname or . ~/Isabelle/SCRIPTS/MeasureQuality/run_data_quality_processQC.csh $RAW_TYPE $DATE $PF . ~/Isabelle/SCRIPTS/MeasureQuality/run_dettrn.csh | ||||||||||||||||||||||
| INSTRUMENT | MIDI | ||||||||||||||||||||||
| RAWTYPE | CAL_DSPTRN | ||||||||||||||||||||||
| PURPOSE | extracting values and comparing them to previous | ||||||||||||||||||||||
| PROCINPUT | products under CAL_DSPTRN | ||||||||||||||||||||||
| QC1TABLE |
trending | table(s) in QC1 database: midi_dettrn | ||||||||||||||||||||||
| TRENDPLOT |
trending | HealthCheck plot(s) associated to this procedure: trend_report_DSPTRN_2.0_HC.html | ||||||||||||||||||||||
| QC1PAGE |
trending | associated documentation: MIDI_QC_tutorial_trans.html | ||||||||||||||||||||||
| QC1PLOTS top |
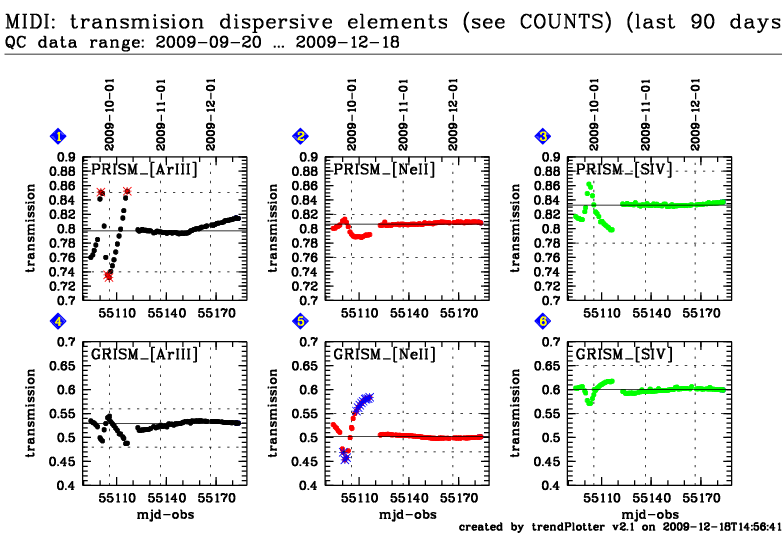
trend_report_DSPTRN_2.0_HC.png Transmission of the dispersive elements | ||||||||||||||||||||||
| QC1PARAM |
QC1 parameters written into QC1 table: QC1db names: midi_dettrn FITS key names: QC.TRN.F4/5/6.PR/GR.TRANS | QC.TRN.F1/2/3.OP.COUNTS | QC.TRN.F4/5/6.PR/GR.COUNTS QC1 params created by pipeline: all QC1 params created by this procedure: none | ||||||||||||||||||||||
| ALGORITHM |
Description of algorithms: (param name): The number of counts is measured using 3 different filters (ArIII, SIV, NeII) in the OPEN position and then using the PRISM (PR.F4/5/6) and the GRISM (GR.F4/5/6). The transmission for the PRISM in ARIII is calculated with number_counts_PR_ARIII/number_counts_OPEN_ARIII | ||||||||||||||||||||||
| CERTIF |
(guidelines for acceptance/rejection) iValue should be around .8 for the PRISM, and .5 for the GRISM. They should not differ too much from the normal value in the HC plots. | ||||||||||||||||||||||
| COMMENTS | (any comments) | ||||||||||||||||||||||
| top | [2010-01-26T08:57:23] created by qcDocu v1.1.2, a tqs tool | ||||||||||||||||||||||