Plot
? |
Symb
? |
Source
* |
Average ? |
Thresholds ? |
N_
data |
QC1
parameter |
Data
downloads |
Remarks |
| method |
value |
unit |
method |
value |
| 1 |
• | QC1DB |
MEDIAN |
0.00217 |
NONE |
VAL | 0.0018,0.00350 |
13 |
thru1 |
this |
last_yr |
all
|
averaged across all IFUs |
| 2 |
• | QC1DB |
MEDIAN |
0.000113 |
NONE |
VAL | 0.0001,0.00018 |
13 |
thru1 |
this |
last_yr |
all
|
rms for all IFUs |
| 4 |
• | QC1DB |
MEDIAN |
47.4 |
NONE |
10% | ± 4.74 |
13 |
thru2 |
this |
last_yr |
all
|
averaged across all IFUs |
| 5 |
• | QC1DB |
MEDIAN |
2.39 |
NONE |
20% | ± 0.479 |
13 |
thru2 |
this |
last_yr |
all
|
rms for all IFUs |
| 6 |
• | QC1DB |
MEDIAN |
2.41 |
NONE |
20% | ± 0.483 |
13 |
thru2err |
this |
last_yr |
all
|
averaged across all IFUs |
| |
|
*Data sources: QC1DB: QC1 database; LOCAL: local data source
|
Plot 1
scores:  1| 1|
| | data source: | muse_throughput
(QC1 database) |
| dataset: | thru1 | • |
| median: | 0.00217 | NONE |
| fixed thresholds: | 0.0018...0.0035 | NONE |
| N_data plotted: | 13 |
| [click plot for closeup] |
Plot 2
scores: 1|
| | data source: | muse_throughput
(QC1 database) |
| dataset: | thru1 | • |
| median: | 0.000113 | NONE |
| fixed thresholds: | 0.0001...0.00018 | NONE |
| N_data plotted: | 13 |
| [click plot for closeup] |
Plot 4
scores: no current data
| | data source: | muse_throughput
(QC1 database) |
| dataset: | thru2 | • |
| median: | 47.4 | NONE |
| rel. thresholds: ±10% | 42.62238...52.09402 | NONE |
| N_data plotted: | 13 |
| [click plot for closeup] |
Plot 5
scores: no current data
| | data source: | muse_throughput
(QC1 database) |
| dataset: | thru2 | • |
| median: | 2.39 | NONE |
| rel. thresholds: ±20% | 1.914112...2.871168 | NONE |
| N_data plotted: | 13 |
| [click plot for closeup] |
Plot 6
scores: no current data
| | data source: | muse_throughput
(QC1 database) |
| dataset: | thru2err | • |
| median: | 2.41 | NONE |
| rel. thresholds: ±20% | 1.93184...2.89776 | NONE |
| N_data plotted: | 13 |
| [click plot for closeup] |
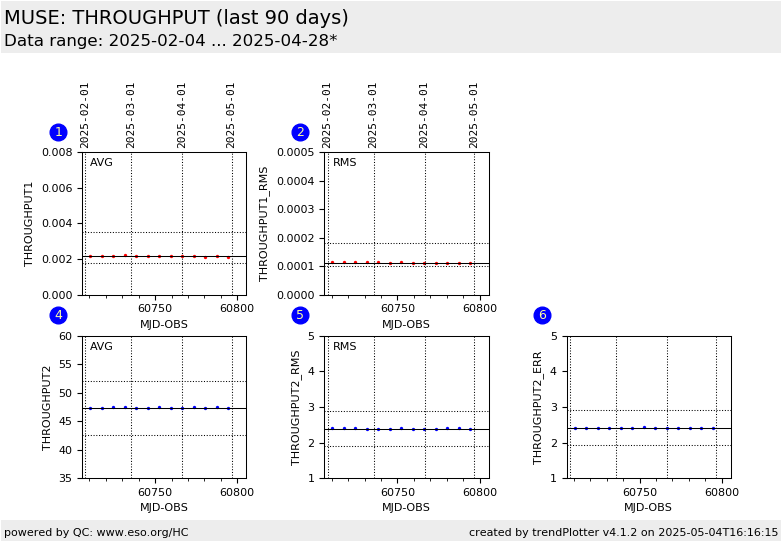
This is MUSE THROUGHPUT health check plot. The upper panels show
the averaged channel throughput compared to photodiode 1 (in percent)
and the lower panels the averaged channel throughput compared to
photodiode 2 (in percent). Panel 6 plots the estimated error of
throughput compared to photodiode 2 (in percent). Only data points
determined from calibrations taken in the instrumental mode (INS.MODE)
WFM-NOAO-N and the read out mode (DET.READ.CURNAME)
SCI1.0 were selected. The data are averaged across all
detectors (CHANELs).
The THROUGHPUT calibration data are taken with template TPL.ID=MUSE_wfm_tec_efficiency
General information
Click on any of the plots to see a close-up version.
The latest date is indicated on top of the plot.
If configured,
- data points belonging to the latest date are specially marked
- statistical averages are indicated by a solid line, and thresholds by broken lines
- outliers are marked by a red asterisk. They are defined as data points outside the
threshold lines
- "aliens" (= data points outside the plot Y limits) are marked by a red arrow (↑ or ↓)
- you can download the data for each parameter set if the 'Data downloads' link shows up
|
