Plot
? |
Symb
? |
Source
* |
Average ? |
Thresholds ? |
N_
data |
QC1
parameter |
Data
downloads |
Remarks |
| method |
value |
unit |
method |
value |
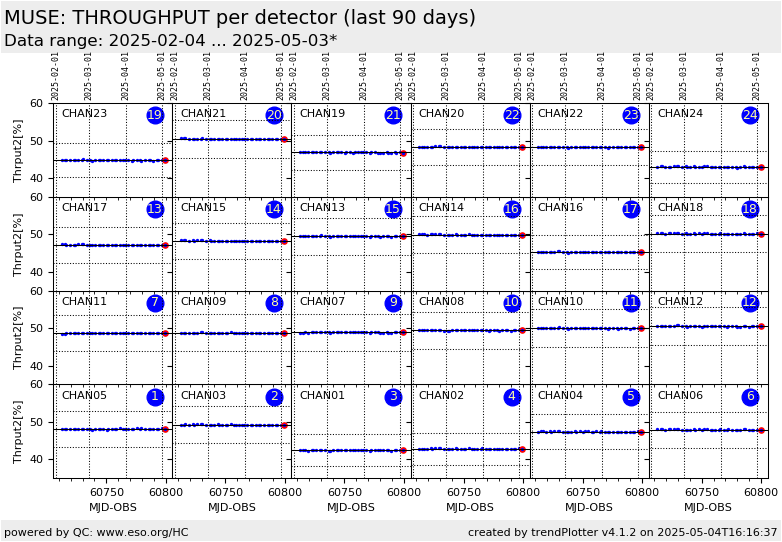
| 1 |
• | QC1DB |
MEDIAN |
48.1 |
NONE |
10% | ± 4.81 |
38 |
thru2 |
this |
last_yr |
all
|
Throughput2 in CHAN05 [%] |
| 2 |
• | QC1DB |
MEDIAN |
49.2 |
NONE |
10% | ± 4.92 |
38 |
thru2 |
this |
last_yr |
all
|
Throughput2 in CHAN03 [%] |
| 3 |
• | QC1DB |
MEDIAN |
42.4 |
NONE |
10% | ± 4.24 |
38 |
thru2 |
this |
last_yr |
all
|
Throughput2 in CHAN01 [%] |
| 4 |
• | QC1DB |
MEDIAN |
42.9 |
NONE |
10% | ± 4.29 |
38 |
thru2 |
this |
last_yr |
all
|
Throughput2 in CHAN02 [%] |
| 5 |
• | QC1DB |
MEDIAN |
47.4 |
NONE |
10% | ± 4.74 |
38 |
thru2 |
this |
last_yr |
all
|
Throughput2 in CHAN04 [%] |
| 6 |
• | QC1DB |
MEDIAN |
48 |
NONE |
10% | ± 4.8 |
38 |
thru2 |
this |
last_yr |
all
|
Throughput2 in CHAN06 [%] |
| 7 |
• | QC1DB |
MEDIAN |
48.7 |
NONE |
10% | ± 4.87 |
38 |
thru2 |
this |
last_yr |
all
|
Throughput2 in CHAN11 [%] |
| 8 |
• | QC1DB |
MEDIAN |
48.8 |
NONE |
10% | ± 4.88 |
38 |
thru2 |
this |
last_yr |
all
|
Throughput2 in CHAN09 [%] |
| 9 |
• | QC1DB |
MEDIAN |
48.9 |
NONE |
10% | ± 4.89 |
38 |
thru2 |
this |
last_yr |
all
|
Throughput2 in CHAN07 [%] |
| 10 |
• | QC1DB |
MEDIAN |
49.5 |
NONE |
10% | ± 4.95 |
38 |
thru2 |
this |
last_yr |
all
|
Throughput2 in CHAN08 [%] |
| 11 |
• | QC1DB |
MEDIAN |
50 |
NONE |
10% | ± 5 |
38 |
thru2 |
this |
last_yr |
all
|
Throughput2 in CHAN10 [%] |
| 12 |
• | QC1DB |
MEDIAN |
50.5 |
NONE |
10% | ± 5.05 |
38 |
thru2 |
this |
last_yr |
all
|
Throughput2 in CHAN12 [%] |
| 13 |
• | QC1DB |
MEDIAN |
47.2 |
NONE |
10% | ± 4.72 |
38 |
thru2 |
this |
last_yr |
all
|
Throughput2 in CHAN17 [%] |
| 14 |
• | QC1DB |
MEDIAN |
48.3 |
NONE |
10% | ± 4.83 |
38 |
thru2 |
this |
last_yr |
all
|
Throughput2 in CHAN15 [%] |
| 15 |
• | QC1DB |
MEDIAN |
49.6 |
NONE |
10% | ± 4.96 |
38 |
thru2 |
this |
last_yr |
all
|
Throughput2 in CHAN13 [%] |
| 16 |
• | QC1DB |
MEDIAN |
49.9 |
NONE |
10% | ± 4.99 |
38 |
thru2 |
this |
last_yr |
all
|
Throughput2 in CHAN14 [%] |
| 17 |
• | QC1DB |
MEDIAN |
45.3 |
NONE |
10% | ± 4.53 |
38 |
thru2 |
this |
last_yr |
all
|
Throughput2 in CHAN16 [%] |
| 18 |
• | QC1DB |
MEDIAN |
50.2 |
NONE |
10% | ± 5.02 |
38 |
thru2 |
this |
last_yr |
all
|
Throughput2 in CHAN18 [%] |
| 19 |
• | QC1DB |
MEDIAN |
44.8 |
NONE |
10% | ± 4.48 |
38 |
thru2 |
this |
last_yr |
all
|
Throughput2 in CHAN23 [%] |
| 20 |
• | QC1DB |
MEDIAN |
50.5 |
NONE |
10% | ± 5.05 |
38 |
thru2 |
this |
last_yr |
all
|
Throughput2 in CHAN21 [%] |
| 21 |
• | QC1DB |
MEDIAN |
46.9 |
NONE |
10% | ± 4.69 |
38 |
thru2 |
this |
last_yr |
all
|
Throughput2 in CHAN19 [%] |
| 22 |
• | QC1DB |
MEDIAN |
48.4 |
NONE |
10% | ± 4.84 |
38 |
thru2 |
this |
last_yr |
all
|
Throughput2 in CHAN20 [%] |
| 23 |
• | QC1DB |
MEDIAN |
48.3 |
NONE |
10% | ± 4.83 |
38 |
thru2 |
this |
last_yr |
all
|
Throughput2 in CHAN22 [%] |
| 24 |
• | QC1DB |
MEDIAN |
43.1 |
NONE |
10% | ± 4.31 |
38 |
thru2 |
this |
last_yr |
all
|
Throughput2 in CHAN24 [%] |
| |
|
*Data sources: QC1DB: QC1 database; LOCAL: local data source
|
