Plot
? |
Symb
? |
Source
* |
Average ? |
Thresholds ? |
N_
data |
QC1
parameter |
Data
downloads |
Remarks |
| method |
value |
unit |
method |
value |
| 1 |
• | QC1DB |
MEDIAN |
13953.9 |
ADU |
VAL | 1900,62000 |
9 |
qc_raw_counts_iframe |
this |
last_yr |
all
|
readmode = SlowPolarimetry, CAM=1 |
| 2 |
• | QC1DB |
MEDIAN |
13953.9 |
ADU |
VAL | 1900,62000 |
9 |
qc_raw_counts_iframe |
this |
last_yr |
all
|
readmode = SlowPolarimetry, CAM=2 |
| 3 |
• | QC1DB |
MEDIAN |
4415.16 |
ADU |
VAL | 1900,62000 |
10 |
qc_raw_counts_iframe |
this |
last_yr |
all
|
readmode = FastPolarimetry, CAM=1 |
| 4 |
• | QC1DB |
MEDIAN |
4415.16 |
ADU |
VAL | 1200,62000 |
10 |
qc_raw_counts_iframe |
this |
last_yr |
all
|
readmode = FastPolarimetry, CAM=2 |
| |
|
*Data sources: QC1DB: QC1 database; LOCAL: local data source
|
Plot 1
scores:  1| 1|
| | data source: | sphere_zimpol_modem_eff
(QC1 database) |
| dataset: | qc_raw_counts_iframe | • |
| median: | 13953.9 | ADU |
| fixed thresholds: | 1900...62000 | ADU |
| N_data plotted: | 9 |
| [click plot for closeup] |
Plot 2
scores: 1|
| | data source: | sphere_zimpol_modem_eff
(QC1 database) |
| dataset: | qc_raw_counts_iframe | • |
| median: | 13953.9 | ADU |
| fixed thresholds: | 1900...62000 | ADU |
| N_data plotted: | 9 |
| [click plot for closeup] |
Plot 3
scores: 1|
| | data source: | sphere_zimpol_modem_eff
(QC1 database) |
| dataset: | qc_raw_counts_iframe | • |
| median: | 4415.16 | ADU |
| fixed thresholds: | 1900...62000 | ADU |
| N_data plotted: | 10 |
| [click plot for closeup] |
Plot 4
scores: 1|
| | data source: | sphere_zimpol_modem_eff
(QC1 database) |
| dataset: | qc_raw_counts_iframe | • |
| median: | 4415.16 | ADU |
| fixed thresholds: | 1200...62000 | ADU |
| N_data plotted: | 10 |
| [click plot for closeup] |
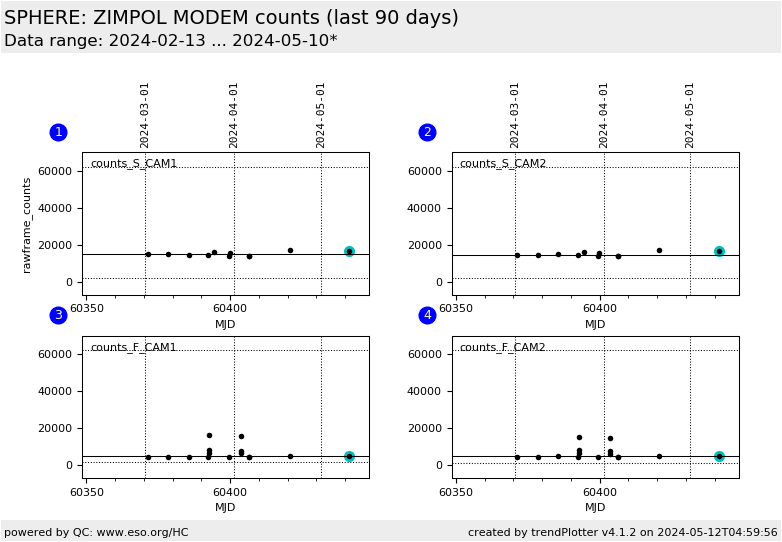
The four boxes show the counts in the raw frames of the modulation demodulation efficiency calibrations
for
- both detectors (CAM1 and CAM2) and
- both readmodes (S= SlowPolarimetry and F=FastPolarimetry).
The counts in the raw frames are composed of a bias level of ~1000 ADU
plus lamp flux. For every raw frame, the counts are taken in one even row
(pixel area = [60 268 260 268]) and in one odd row (pixel area = [60 269
260 269]). The average over all raw frame planes of the cube is taken,
resulting in a mean odd_row and a mean even_row counts for both detectors.
The maximum between the even_row and odd_row values is taken, for both
cameras separately. The maximum over all raw frames is taken. This QC
parameter is used to check for saturation and under-illumination.
General information
Click on any of the plots to see a close-up version.
The latest date is indicated on top of the plot.
If configured,
- data points belonging to the latest date are specially marked
- statistical averages are indicated by a solid line, and thresholds by broken lines
- outliers are marked by a red asterisk. They are defined as data points outside the
threshold lines
- "aliens" (= data points outside the plot Y limits) are marked by a red arrow (↑ or ↓)
- you can download the data for each parameter set if the 'Data downloads' link shows up
|
