Plot
? |
Symb
? |
Source
* |
Average ? |
Thresholds ? |
N_
data |
QC1
parameter |
Data
downloads |
Remarks |
| method |
value |
unit |
method |
value |
| 1 |
• | QC1DB |
MEDIAN |
3.64 |
NONE |
VAL | 0,22.0 |
82 |
qc_PN_maxrat |
this |
last_yr |
all
|
100k/1pt/hg |
| 2 |
• | QC1DB |
MEDIAN |
3.12 |
NONE |
VAL | 0,25.0 |
82 |
qc_PN_maxrat |
this |
last_yr |
all
|
100k/1pt/hg/1x2 |
| 3 |
• | QC1DB |
MEDIAN |
3.05 |
NONE |
VAL | 0,20.0 |
82 |
qc_PN_maxrat |
this |
last_yr |
all
|
100k/1pt/hg/2x2 |
| 4 |
• | QC1DB |
MEDIAN |
124 |
NONE |
VAL | 0,300.0 |
82 |
qc_PN_maxrat |
this |
last_yr |
all
|
400k/1pt/lg |
| 5 |
• | QC1DB |
MEDIAN |
155 |
NONE |
VAL | 0,250.0 |
82 |
qc_PN_maxrat |
this |
last_yr |
all
|
400k/1pt/lg/1x2 |
| 6 |
• | QC1DB |
MEDIAN |
77.7 |
NONE |
VAL | 0,110.0 |
82 |
qc_PN_maxrat |
this |
last_yr |
all
|
400k/1pt/lg/2x2 |
| |
|
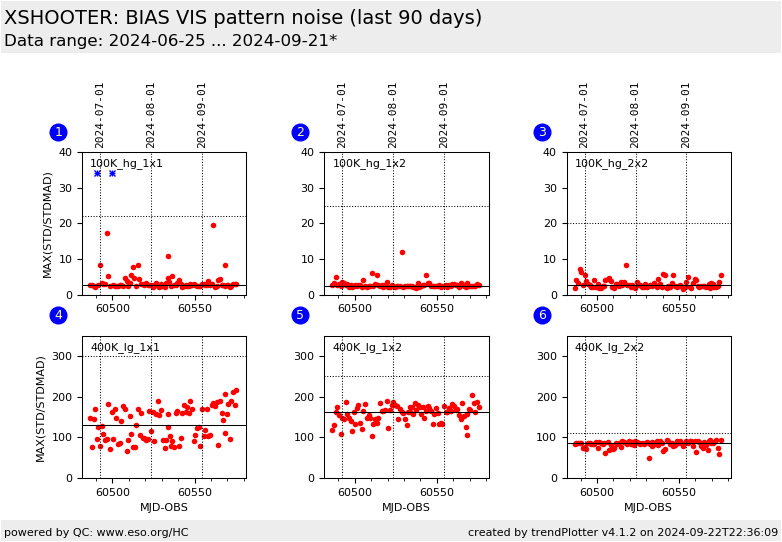
*Data sources: QC1DB: QC1 database; LOCAL: local data source
|
Plot 1
scores: no current data
| | data source: | xshooter_bias
(QC1 database) |
| dataset: | qc_PN_maxrat | • |
| median: | 3.64 | NONE |
| fixed thresholds: | 0...22.0 | NONE |
| N_data plotted: | 82 |
| [click plot for closeup] |
Plot 2
scores: no current data
| | data source: | xshooter_bias
(QC1 database) |
| dataset: | qc_PN_maxrat | • |
| median: | 3.12 | NONE |
| fixed thresholds: | 0...25.0 | NONE |
| N_data plotted: | 82 |
| [click plot for closeup] |
Plot 3
scores: no current data
| | data source: | xshooter_bias
(QC1 database) |
| dataset: | qc_PN_maxrat | • |
| median: | 3.05 | NONE |
| fixed thresholds: | 0...20.0 | NONE |
| N_data plotted: | 82 |
| [click plot for closeup] |
Plot 4
scores: no current data
| | data source: | xshooter_bias
(QC1 database) |
| dataset: | qc_PN_maxrat | • |
| median: | 124 | NONE |
| fixed thresholds: | 0...300.0 | NONE |
| N_data plotted: | 82 |
| [click plot for closeup] |
Plot 5
scores: no current data
| | data source: | xshooter_bias
(QC1 database) |
| dataset: | qc_PN_maxrat | • |
| median: | 155 | NONE |
| fixed thresholds: | 0...250.0 | NONE |
| N_data plotted: | 82 |
| [click plot for closeup] |
Plot 6
scores: no current data
| | data source: | xshooter_bias
(QC1 database) |
| dataset: | qc_PN_maxrat | • |
| median: | 77.7 | NONE |
| fixed thresholds: | 0...110.0 | NONE |
| N_data plotted: | 82 |
| [click plot for closeup] |
Since 2021 the xshooter_mbias recipe is executed with the
--pd_noise_compute=TRUE command line option that performs a 2D
Fourier transform of each of the five raw BIAS frames and calculates
the (not robust) standard deviation and (robust) MAD (median absolute
deviation). Both parameters are ingested into the QC1 DB, and the maximum of the five
std/stdMAD values (qc_PN_maxrat in the DB) is monitored here .
The purpose of the analysis is to discriminate statistical noise, and non-statistical noise.
More information can be found at the plot tutorial page
General information
Click on any of the plots to see a close-up version.
The latest date is indicated on top of the plot.
If configured,
- data points belonging to the latest date are specially marked
- statistical averages are indicated by a solid line, and thresholds by broken lines
- outliers are marked by a red asterisk. They are defined as data points outside the
threshold lines
- "aliens" (= data points outside the plot Y limits) are marked by a red arrow (↑ or ↓)
- you can download the data for each parameter set if the 'Data downloads' link shows up
|
