Plot
? |
Symb
? |
Source
* |
Average ? |
Thresholds ? |
N_
data |
QC1
parameter |
Data
downloads |
Remarks |
| method |
value |
unit |
method |
value |
| 1 |
• | QC1DB |
none |
|
ratio |
none | |
208 |
sn1 |
this |
last_yr |
all
|
SNR lamda-range=[1514:1548] |
| 2 |
• | QC1DB |
none |
|
ratio |
none | |
157 |
sn2 |
this |
last_yr |
all
|
SNR lamda-range=[2214:2243] |
| 3 |
• | QC1DB |
none |
|
ratio |
none | |
208 |
sn1 |
this |
last_yr |
all
|
SNR*SNR lamda-range=[1514:1548] |
| 4 |
• | QC1DB |
none |
|
ratio |
none | |
157 |
sn2 |
this |
last_yr |
all
|
SNR*SNR lamda-range=[2214:2243] |
| |
|
*Data sources: QC1DB: QC1 database; LOCAL: local data source
|
Plot 1
scores: not implemented
| | data source: | xshooter_telluric
(QC1 database) |
| dataset: | sn1 | • |
| average: | none |
| thresholds: | none |
| N_data plotted: | 208 |
| [click plot for closeup] |
Plot 2
scores: not implemented
| | data source: | xshooter_telluric
(QC1 database) |
| dataset: | sn2 | • |
| average: | none |
| thresholds: | none |
| N_data plotted: | 157 |
| [click plot for closeup] |
Plot 3
scores: not implemented
| | data source: | xshooter_telluric
(QC1 database) |
| dataset: | sn1 | • |
| average: | none |
| thresholds: | none |
| N_data plotted: | 208 |
| [click plot for closeup] |
Plot 4
scores: not implemented
| | data source: | xshooter_telluric
(QC1 database) |
| dataset: | sn2 | • |
| average: | none |
| thresholds: | none |
| N_data plotted: | 157 |
| [click plot for closeup] |
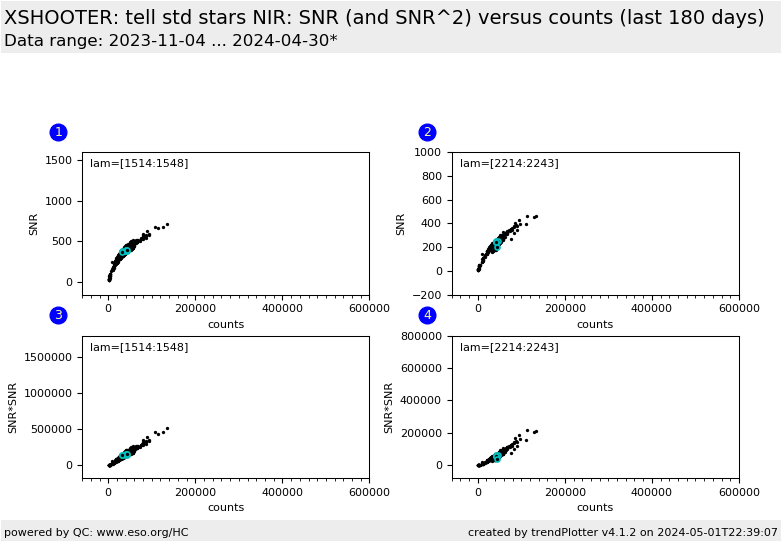
The upper boxes show the relation between the signal-to-noise ratio
and the counts (the signal). The values are derived from telluric standard stars
acquired in slit mode. The values are extracted from different wavelength regions
known to be free of telluric features.
The lower boxes show the relation between the isquere of the signal-to-noise ratio
and the counts (the signal). This is to show deviation from the square root
law.
General information
Click on any of the plots to see a close-up version.
The latest date is indicated on top of the plot.
If configured,
- data points belonging to the latest date are specially marked
- statistical averages are indicated by a solid line, and thresholds by broken lines
- outliers are marked by a red asterisk. They are defined as data points outside the
threshold lines
- "aliens" (= data points outside the plot Y limits) are marked by a red arrow (↑ or ↓)
- you can download the data for each parameter set if the 'Data downloads' link shows up
|
