XSHOOTER trending system: HEALTH CHECK report
Last update: 2026-06-22T22:43:40 (UT)
[enable javascript for displaying time difference!]
General news:
NOTE: The Health Check and calChecker services have been moved to qcFlow. These pages are only maintained for comparison
and will be removed in 2026.
XSHOOTER news:
Report news:
Plot? Symb? Source Average ? Thresholds ? N_ QC1 Data Remarks
method value unit method value
1
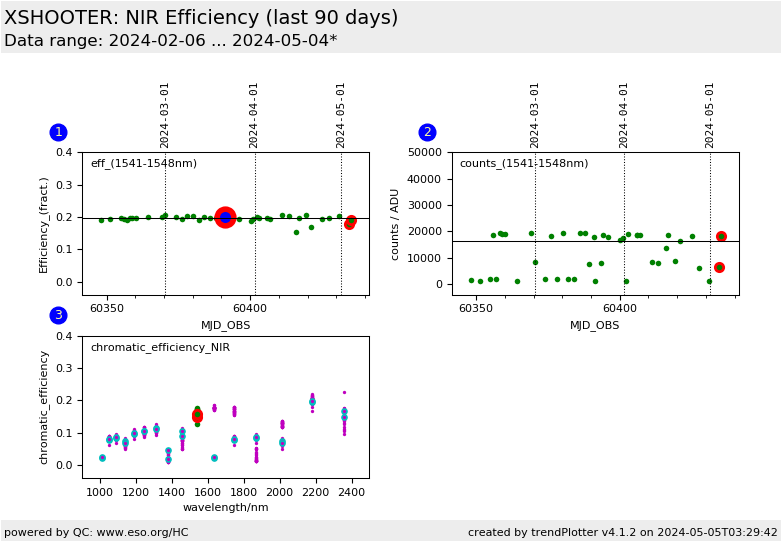
• QC1DB MEDIAN 0.222 NONE none 43 eff1
this |
last_yr |
all
Relative efficiency for NIR arm, range 1541-1548 nm
1
◊ QC1DB none NONE none 0 eff1
this |
last_yr |
all
EFFMON template, data acquired under photometric conditions
2
• QC1DB MEDIAN 2.08e+04 ADU none 43 counts1
this |
last_yr |
all
median star counts in NIR arm, range 1541-1548 nm
3
• QC1DB none NONE none 43 med_eff_0
this |
last_yr |
all
Chromatic efficiency plot for NIR arm ; the values trended in plot are marked. The plot is constituted from the following wavelength ranges: 2357 nm
3
• QC1DB none NONE none 43 med_eff_1
this |
last_yr |
all
2181 nm
3
• QC1DB none NONE none 43 med_eff_2
this |
last_yr |
all
2011 nm
3
• QC1DB none NONE none 43 med_eff_3
this |
last_yr |
all
1868 nm
3
• QC1DB none NONE none 43 med_eff_4
this |
last_yr |
all
1744 nm
3
• QC1DB none NONE none 43 med_eff_5
this |
last_yr |
all
1635 nm
3
• QC1DB none NONE none 43 med_eff_6
this |
last_yr |
all
1539 nm
3
• QC1DB none NONE none 43 med_eff_7
this |
last_yr |
all
1454 nm
3
• QC1DB none NONE none 35 med_eff_8
this |
last_yr |
all
1377 nm
3
• QC1DB none NONE none 43 med_eff_9
this |
last_yr |
all
1309 nm
3
• QC1DB none NONE none 43 med_eff_10
this |
last_yr |
all
1246 nm
3
• QC1DB none NONE none 43 med_eff_11
this |
last_yr |
all
1190 nm
3
• QC1DB none NONE none 41 med_eff_12
this |
last_yr |
all
1138 nm
3
• QC1DB none NONE none 43 med_eff_13
this |
last_yr |
all
1091 nm
3
• QC1DB none NONE none 43 med_eff_14
this |
last_yr |
all
1048 nm
3
• QC1DB none NONE none 43 med_eff_15
this |
last_yr |
all
1012 nm
*Data sources: QC1DB: QC1 database; LOCAL: local data source
Plot 1 scores: not implemented
data source: xshooter_fluxeff dataset: eff1 • median: 0.222 NONE thresholds: none N_data plotted: 43 [click plot for closeup]
Plot 2 scores: not implemented
data source: xshooter_fluxeff dataset: counts1 • median: 2.08e+04 ADU thresholds: none N_data plotted: 43 [click plot for closeup]
Plot 3 scores: not implemented
data source: xshooter_fluxeff dataset: med_eff_0 • average: none thresholds: none N_data plotted: 43 [click plot for closeup]
This plot
This plot shows the efficiency per echelle order.
The efficiency is obtained from flux standard stars
acquired with a 5 arcsec wide slit.
The different count rates in Plot No. 2 originate from the
different magnitutes within the set of used flux standard stars.
General information
Click on any of the plots to see a close-up version .
The latest date is indicated on top of the plot.
If configured,
data points belonging to the latest date are specially marked statistical averages are indicated by a solid line, and thresholds by broken lines outliers are marked by a red asterisk. They are defined as data points outside the
threshold lines "aliens" (= data points outside the plot Y limits) are marked by a red arrow (↑ ↓ you can download the data for each parameter set if the 'Data downloads' link shows up
