Plot
? |
Symb
? |
Source
* |
OPS?
** |
Average ? |
Thresholds ? |
N_
data |
QC1
parameter |
Data
downloads |
Remarks |
| method |
value |
unit |
method |
value |
| 1 |
• | QC1DB |
no |
none |
|
arcsec |
none | |
32 |
iq_dimm |
this |
last_yr |
all
|
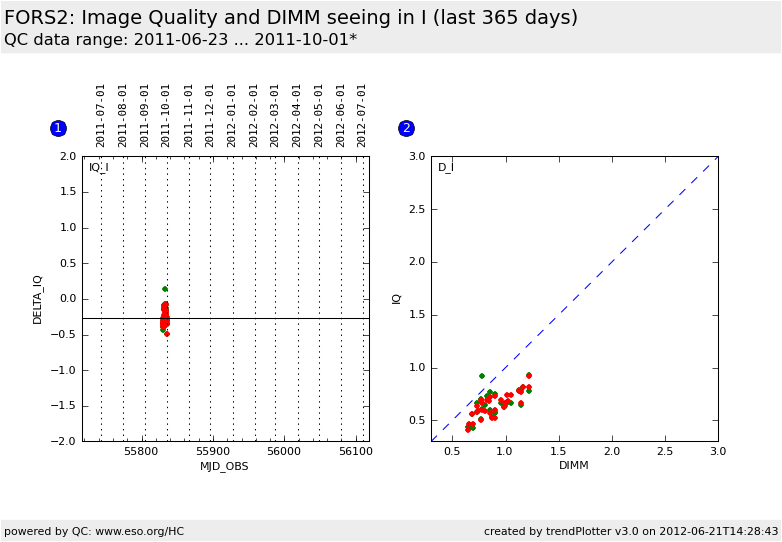
difference between Image Quality and DIMM seeing (arcsec, Chip 2) |
| 1 |
• | QC1DB |
no |
MEDIAN |
-0.270123 |
arcsec |
none | |
32 |
iq_dimm |
this |
last_yr |
all
|
difference between Image Quality and DIMM seeing (arcsec, Chip 1) |
| 2 |
• | QC1DB |
no |
none |
|
arcsec |
none | |
32 |
iq |
this |
last_yr |
all
|
Image Quality vs DIMM seeing with 1:1 line overplotted (arcsec, Chip 2) |
| 2 |
• | QC1DB |
no |
none |
|
arcsec |
none | |
32 |
iq |
this |
last_yr |
all
|
Image Quality vs DIMM seeing with 1:1 line overplotted (arcsec, Chip 1) |
| |
|
*Data sources: QC1DB: QC1 database; LOCAL: local text file | **OPS: to indicate that OPSLOG data are included
|
Plot 1
scores: not implemented
| | data source: | fors2_sci_img
(QC1 database) |
dataset:
(numbers below apply to this dataset) | iq_dimm | • |
| average: | none |
| thresholds: | none |
| N_data plotted: | 32 |
| [click on plot for closeup] |
Plot 2
scores: not implemented
| | data source: | fors2_sci_img
(QC1 database) |
dataset:
(numbers below apply to this dataset) | iq | • |
| average: | none |
| thresholds: | none |
| N_data plotted: | 32 |
| [click on plot for closeup] |
Starting with Period 71 (April 2003), all reduced FORS2 science images
taken in Service Mode are analyzed in order to estimate their Image
Quality (hereafter IQ). This is done in a fully automatic way using a
stand-alone procedure based on the Sextractor object detection
algorithm (Bertin and Arnouts 1996 A&A 117,393). Stars are identified
based on Sextractor parameters (Stellarity Index > 0.5, ellipticity
<0.5 and quality FLAG=0) and their FWHM is measured by the
program. Then the mode of the IQ distribution is computed and the RMS
deviation is estimated using the left wing of the distribution
only. Only IQ measurements obtained with the Standard Resolution (SR)
collimator and taken through the broad-band UBVRI filters are trended
here. To reduce the uncertainty, only image quality values are
plotted, which result from more than 10 stars and have at at
least one DIMM seeing measurement during their exposure time. To
avoid a bias from deep exposures, where galaxies dominate the field,
we require in addition that the average ellipticity is less than
0.3 and the rms of the image quality is below 0.2.
For comparison the DIMM seeing values are corrected to the airmass and
wavelength of the respective science images.
More information can be found on
the plot tutorial page
General information
Click on any of the plots to see a close-up version.
The latest date is indicated on top of the plot, data points belonging to that date are specially marked.
If configured,
- statistical averages are indicated by a solid line, and thresholds by broken lines
- outliers are marked by a red asterisk. They are defined as data points outside the
threshold lines
- "aliens" (= data points outside the plot Y limits) are marked by a red arrow (↑ or ↓)
- you can download the data for each parameter set if the 'Data downloads' link shows up
|
