Plot
? |
Symb
? |
Source
* |
Average ? |
Thresholds ? |
N_
data |
QC1
parameter |
Data
downloads |
Remarks |
| method |
value |
unit |
method |
value |
| 1 |
• | QC1DB |
MEDIAN |
1.38e+03 |
NONE |
VAL | 1250,1450 |
5 |
central_resol |
this |
last_yr |
all
|
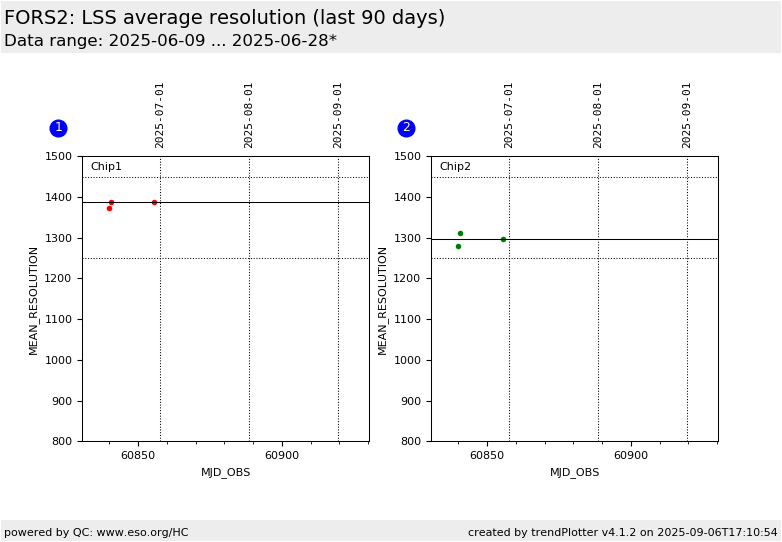
average resolution at center for chip 1 |
| 2 |
• | QC1DB |
MEDIAN |
1.29e+03 |
NONE |
VAL | 1250,1450 |
5 |
central_resol |
this |
last_yr |
all
|
average resolution at center for chip 2 |
| |
|
*Data sources: QC1DB: QC1 database; LOCAL: local data source
|
Plot 1
scores:  1| 1|
| | data source: | fors2_lss_wave
(QC1 database) |
| dataset: | central_resol | • |
| median: | 1.38e+03 | NONE |
| fixed thresholds: | 1250...1450 | NONE |
| N_data plotted: | 5 |
| [click plot for closeup] |
Plot 2
scores: 1|
| | data source: | fors2_lss_wave
(QC1 database) |
| dataset: | central_resol | • |
| median: | 1.29e+03 | NONE |
| fixed thresholds: | 1250...1450 | NONE |
| N_data plotted: | 5 |
| [click plot for closeup] |
From a wavelength calibrated LSS arc lamp exposure, the mean spectral resolution from all lines in the catalog is computed. Each single spectral resolution is computed as the ratio between the arc lamp line wavelength and its FWHM. The values trended here are for the
red sensitive MIT detector, the 300V grism with no filter and a slit width of 0.29".
On 2018-08-28 new pipeline (v.5.3.35) was introduced. The method of calculating spectral resolution changed and the new values are significantly lower.
On 2024-09-01 binning of the LSS_HC_LAMP calibrations was changed from 2x2 to 1x1. This created a jump in the resolution estimates.
DB Name: fors2_lss_wave
TPL.ID: FORS2_lss_cal_daycalib
QC1 DB parameter: central_resol
More information can be found on
the plot tutorial page
General information
Click on any of the plots to see a close-up version.
The latest date is indicated on top of the plot.
If configured,
- data points belonging to the latest date are specially marked
- statistical averages are indicated by a solid line, and thresholds by broken lines
- outliers are marked by a red asterisk. They are defined as data points outside the
threshold lines
- "aliens" (= data points outside the plot Y limits) are marked by a red arrow (↑ or ↓)
- you can download the data for each parameter set if the 'Data downloads' link shows up
|
