Plot
? |
Symb
? |
Source
* |
Average ? |
Thresholds ? |
N_
data |
QC1
parameter |
Data
downloads |
Remarks |
| method |
value |
unit |
method |
value |
| 1 |
• | QC1DB |
MEDIAN |
|
NONE |
none | |
0 |
efficiency_6 |
this |
last_yr |
all
|
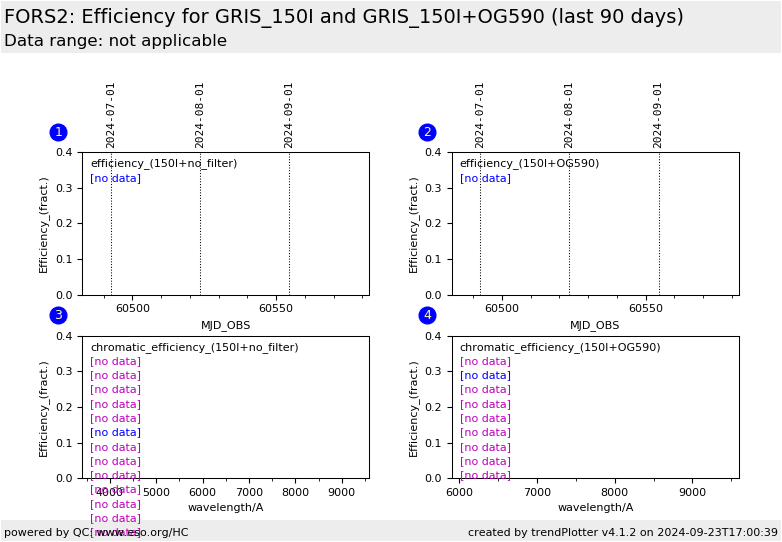
Relative efficiency for grism 150I, no filter (upper CCD), range 5700A; all lss_slit_pos are plotted here |
| 2 |
• | QC1DB |
MEDIAN |
0.176 |
NONE |
none | |
1 |
efficiency_8 |
this |
last_yr |
all
|
Relative efficiency for grism 150I, for filter OG590 (upper CCD), range 6500A; all lss_slit_pos are plotted here |
|
| 3 |
• | QC1DB |
none |
|
NONE |
none | |
0 |
efficiency_1 |
this |
last_yr |
all
|
Chromatic efficiency plot for grism 150I, no filter; the values trended in plot are marked. The plot is constituted from the following wavelength ranges: 3700A |
| 3 |
• | QC1DB |
none |
|
NONE |
none | |
0 |
efficiency_2 |
this |
last_yr |
all
|
4100A |
| 3 |
• | QC1DB |
none |
|
NONE |
none | |
0 |
efficiency_3 |
this |
last_yr |
all
|
4500A |
| 3 |
• | QC1DB |
none |
|
NONE |
none | |
0 |
efficiency_4 |
this |
last_yr |
all
|
4900A |
| 3 |
• | QC1DB |
none |
|
NONE |
none | |
0 |
efficiency_5 |
this |
last_yr |
all
|
5300A |
| 3 |
• | QC1DB |
none |
|
NONE |
none | |
0 |
efficiency_6 |
this |
last_yr |
all
|
5700A |
| 3 |
• | QC1DB |
none |
|
NONE |
none | |
0 |
efficiency_7 |
this |
last_yr |
all
|
6100A |
| 3 |
• | QC1DB |
none |
|
NONE |
none | |
0 |
efficiency_8 |
this |
last_yr |
all
|
6500A |
| 3 |
• | QC1DB |
none |
|
NONE |
none | |
0 |
efficiency_9 |
this |
last_yr |
all
|
6900A |
| 3 |
• | QC1DB |
none |
|
NONE |
none | |
0 |
efficiency_10 |
this |
last_yr |
all
|
7300A |
| 3 |
• | QC1DB |
none |
|
NONE |
none | |
0 |
efficiency_11 |
this |
last_yr |
all
|
7700A |
| 3 |
• | QC1DB |
none |
|
NONE |
none | |
0 |
efficiency_12 |
this |
last_yr |
all
|
8100A |
| 3 |
• | QC1DB |
none |
|
NONE |
none | |
0 |
efficiency_13 |
this |
last_yr |
all
|
8500A |
| 3 |
• | QC1DB |
none |
|
NONE |
none | |
0 |
efficiency_14 |
this |
last_yr |
all
|
8900A |
| 3 |
• | QC1DB |
none |
|
NONE |
none | |
0 |
efficiency_15 |
this |
last_yr |
all
|
9300A |
|
| 4 |
• | QC1DB |
none |
|
NONE |
none | |
1 |
efficiency_7 |
this |
last_yr |
all
|
Chromatic efficiency plot for grism 150I, and filter OG590 ; the values trended in plot are marked. The plot is constituted from the following wavelength ranges: 6100A |
| 4 |
• | QC1DB |
none |
|
NONE |
none | |
1 |
efficiency_8 |
this |
last_yr |
all
|
6500A |
| 4 |
• | QC1DB |
none |
|
NONE |
none | |
1 |
efficiency_9 |
this |
last_yr |
all
|
6900A |
| 4 |
• | QC1DB |
none |
|
NONE |
none | |
1 |
efficiency_10 |
this |
last_yr |
all
|
7300A |
| 4 |
• | QC1DB |
none |
|
NONE |
none | |
1 |
efficiency_11 |
this |
last_yr |
all
|
7700A |
| 4 |
• | QC1DB |
none |
|
NONE |
none | |
1 |
efficiency_12 |
this |
last_yr |
all
|
8100A |
| 4 |
• | QC1DB |
none |
|
NONE |
none | |
1 |
efficiency_13 |
this |
last_yr |
all
|
8500A |
| 4 |
• | QC1DB |
none |
|
NONE |
none | |
1 |
efficiency_14 |
this |
last_yr |
all
|
8900A |
| 4 |
• | QC1DB |
none |
|
NONE |
none | |
1 |
efficiency_15 |
this |
last_yr |
all
|
9300A |
| |
|
*Data sources: QC1DB: QC1 database; LOCAL: local data source
|
Plot 1
scores: not implemented
| | data source: | fors2_response
(QC1 database) |
| dataset: | efficiency_6 | • |
| median: | no data | NONE |
| thresholds: | none | |
| N_data plotted: | 0 |
| [click plot for closeup] |
Plot 2
scores: not implemented
| | data source: | fors2_response
(QC1 database) |
| dataset: | efficiency_8 | • |
| median: | 0.176 | NONE |
| thresholds: | none | |
| N_data plotted: | 1 |
| [click plot for closeup] |
Plot 3
scores: not implemented
| | data source: | fors2_response
(QC1 database) |
dataset:
(numbers below apply to this dataset) | efficiency_1 | • |
| average: | none |
| thresholds: | none |
| N_data plotted: | 0 |
| [click plot for closeup] |
Plot 4
scores: not implemented
| | data source: | fors2_response
(QC1 database) |
dataset:
(numbers below apply to this dataset) | efficiency_7 | • |
| average: | none |
| thresholds: | none |
| N_data plotted: | 1 |
| [click plot for closeup] |
The spectrophotometric standard star observations are taken within three days
of the corresponding science observations and are meant to provide a response
curve for data reduction. They can also be used to
determine the efficiency of the spectroscopic modes of FORS2, provided they
have been taken under photometric conditions which however is not
guaranteed.
Plotted here are:
a) values for the relative efficiency of the system 'telescope +
spectroscopic arm of FORS2' (top), at a representative wavelength (indicated
in the comment); these values can be used for trending
b) all values for the grism and the order separation filter of the upper plot,
displayed over wavelength to obtain a chromatic overview (bottom); the date
range is the same as for the upper plot.
Only data points for the upper
CCD are plotted. The lower CCD usually has no standard stars and no response
curve.
The best current estimate of the efficiency of the spectroscopic modes of
FORS2 is the upper envelope of the data points in the upper panel. Under
'data downloads' you find further information regarding the photometric
stability of the night ('S' if stable, 'N' if unstable, 'U' if
unknown).
More information can be found on
the plot tutorial page
General information
Click on any of the plots to see a close-up version.
The latest date is indicated on top of the plot.
If configured,
- data points belonging to the latest date are specially marked
- statistical averages are indicated by a solid line, and thresholds by broken lines
- outliers are marked by a red asterisk. They are defined as data points outside the
threshold lines
- "aliens" (= data points outside the plot Y limits) are marked by a red arrow (↑ or ↓)
- you can download the data for each parameter set if the 'Data downloads' link shows up
|
