Plot
? |
Symb
? |
Source
* |
Average ? |
Thresholds ? |
N_
data |
QC1
parameter |
Data
downloads |
Remarks |
| method |
value |
unit |
method |
value |
| 1 |
◊ | QC1DB |
none |
|
mag |
none | |
0 |
zeropoint |
this |
last_yr |
all
|
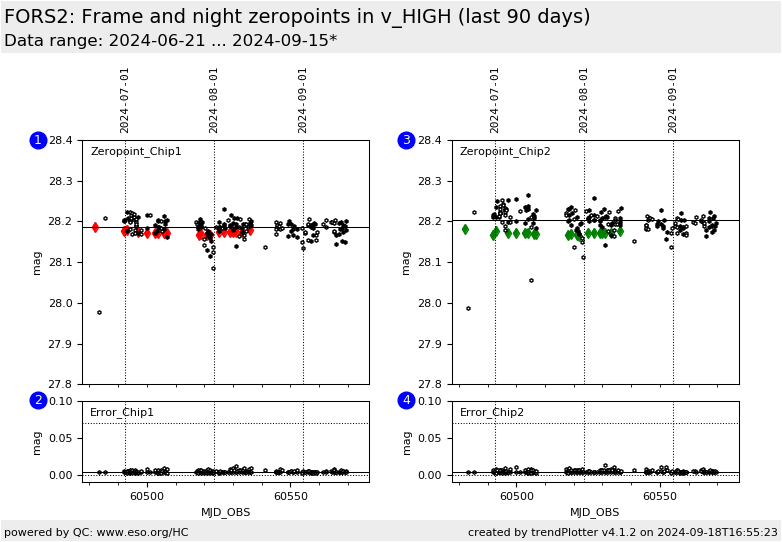
Chip 1: night zeropoint (HC plot: 28 days delay; available since 2012-06) |
| 1 |
♦ | QC1DB |
none |
|
mag |
none | |
0 |
zeropoint |
this |
last_yr |
all
|
same (for stable nights; available since 2012-06) |
| 1 |
o | QC1DB |
MEDIAN |
28.22 |
mag |
none | |
12 |
zp_frame |
this |
last_yr |
all
|
Frame zeropoint (from single measurement; more than 1 star) |
| 1 |
• | QC1DB |
none |
|
mag |
none | |
0 |
zp_frame |
this |
last_yr |
all
|
Frame zeropoint, for stable night |
| 2 |
o | QC1DB |
MEDIAN |
0.006 |
mag |
VAL | 0,0.07 |
12 |
sig_zp_frame |
this |
last_yr |
all
|
Statistical error of frame zeropoint |
|
| 3 |
◊ | QC1DB |
none |
|
mag |
none | |
0 |
zeropoint |
this |
last_yr |
all
|
Chip 2: night zeropoint (HC plot: 28 days delay; available since 2012-06) |
| 3 |
♦ | QC1DB |
none |
|
mag |
none | |
0 |
zeropoint |
this |
last_yr |
all
|
same (for stable nights; available since 2012-06) |
| 3 |
o | QC1DB |
MEDIAN |
28.24 |
mag |
none | |
12 |
zp_frame |
this |
last_yr |
all
|
Frame zeropoint (from single measurement; more than 1 star) |
| 3 |
• | QC1DB |
none |
|
mag |
none | |
0 |
zp_frame |
this |
last_yr |
all
|
Frame zeropoint, for stable night |
| 4 |
o | QC1DB |
MEDIAN |
0.005 |
mag |
VAL | 0,0.07 |
12 |
sig_zp_frame |
this |
last_yr |
all
|
Statistical error of frame zeropoint |
| |
|
*Data sources: QC1DB: QC1 database; LOCAL: local data source
|
Plot 1
scores: not implemented
| | data source: | fors2_photometry
(QC1 database) |
dataset:
(numbers below apply to this dataset) | zeropoint | ◊ |
| average: | none |
| thresholds: | none |
| N_data plotted: | 0 |
| [click plot for closeup] |
Plot 3
scores: not implemented
| | data source: | fors2_photometry
(QC1 database) |
dataset:
(numbers below apply to this dataset) | zeropoint | ◊ |
| average: | none |
| thresholds: | none |
| N_data plotted: | 0 |
| [click plot for closeup] |
Plot 2
scores: not implemented
| | data source: | fors2_zp_frame
(QC1 database) |
| dataset: | sig_zp_frame | o |
| median: | 0.006 | mag |
| fixed thresholds: | 0...0.07 | mag |
| N_data plotted: | 12 |
| [click plot for closeup] |
Plot 4
scores: not implemented
| | data source: | fors2_zp_frame
(QC1 database) |
| dataset: | sig_zp_frame | o |
| median: | 0.005 | mag |
| fixed thresholds: | 0...0.07 | mag |
| N_data plotted: | 12 |
| [click plot for closeup] |
This plot displays two kinds of photometric zeropoints: the frame zeropoints
(calculated by the pipeline recipe fors_zeropoint) and the instrumental
zeropoints (calculated by fors_photometry). The frame zeropoints are based on
individual standard star exposures, while the instrumental zeropoints take
into account all available standard star exposures of a certain number of nights and refer
to that time range. The standard star frames are observed for both CHIP1 and
CHIP2. All zeropoints are based on flux in e-/sec.
The frame zeropoints are calculated assuming a standard extinction
coefficient, which may not be correct for an individual night. The
instrumental zeropoints are based on all extracted sources in a given time
interval around the reference night (plus/minus 14 days). The linear equations
are solved assuming a constant instrumental zeropoint and a constant
extinction coefficient per night. The solutions are quite sensitive to this
assumption of a constant extinction value throughout each night. Only
photometrically stable input nights are accepted for these values.
These
zeropoints are based on the FORS2
calibration plan as part of the FORS2 absolute photometry project. It
foresees the acquisition of an initial pair of standard stars for "promising" nights, and the
follow-up standard star fields for actually photometric nights.
The initial pair is a set of standard star fields taken at the begin of the
night, at two airmasses
separated by at least 0.4.
If the corresponding extinction values differ by no more than 0.05 in all filters (for b_HIGH:
0.06), the night is called at least 'Sb' ("stable at begin"). If there are
follow-up photometric data in the latter course of the same night, again with stable extinction,
the night is called 'S'. If there are such data but the extinction variation
was larger than these thresholds, the flag becomes 'N' (not stable). In all
other cases the photometric quality of the night
is 'U' (unknown). For the instrumental zeropoints, only 'S' and 'Sb' nights
are used.
Due to the
selection window and the data processing schedule, the nightly zeropoints
become available typically after a month.
For the nightly extinction values derived from the nightly zeropoints click on
'extinction'.
The pipeline recipe fors_photometry is operational since 2012-06,
hence the nightly zeropoints are
available from the same date on.
All HISTORY plots earlier than 2012-06 do not have
night zeropoints.
Major mirror interventions (recoating) are
marked by a blue vertical bar.
More information can be found on
the plot
tutorial page.
General information
Click on any of the plots to see a close-up version.
The latest date is indicated on top of the plot.
If configured,
- data points belonging to the latest date are specially marked
- statistical averages are indicated by a solid line, and thresholds by broken lines
- outliers are marked by a red asterisk. They are defined as data points outside the
threshold lines
- "aliens" (= data points outside the plot Y limits) are marked by a red arrow (↑ or ↓)
- you can download the data for each parameter set if the 'Data downloads' link shows up
|
