Quality Control and
Data Processing
GIRAFFE: Calibration lamp stability
The fluxes of all GIRAFFE calibration lamps are monitored here. It is important to control the calibration lamp performance, both over and under exposure should be avoided. Over-exposure is an important issue for the flat-field lamps because the calibration files then are useless (at least for removing the pixel-to-pixel gain variations). Under-exposure for flat-field lamps results in compromised SNR, and for arc lamps in poor emission line detection and low-quality dispersion solution. The calibration lamp fluxes are monitored through regular HC calibrations and deliver health check parameters. They are monitored to discover aging effects, filter degradation or problems with the gripper. We monitor fluxes of two flat-field lamps and two arc lamps:
 Simultaneous arclamp
An exposure (about 120 sec integration time) with the arclamp of the simultaneous calibration unit is daily taken. With the HR grating, they are taken for each of the five fibre systems. For the LR grating, only Medusa1 is taken. See the caption for the exact settings used. These data are used as check of the spectral format (motions of the 2 gratings), of the lamp stability and of the fibre systems health. Find a description of the calibration files and of the grating stability here.
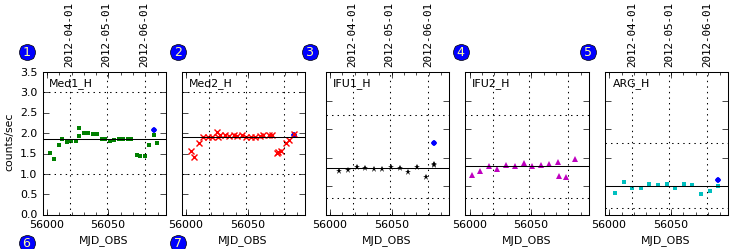
The trending plot has two panels, one with the fluxes from the five HR settings, one with the fluxes from the Medusa1 LR setting (all are taken as daily health checks).
Panel 1 shows the lamp flux (in counts per sec) as measured in each slit system with the HR setting (H525.8B). It shows the lamp performance modulated by the fibre efficiencies. The flux difference between the Medusa and the IFU/Argus systems is due to the different fibre diameter (1.2 arcs versus 0.5 arcs).
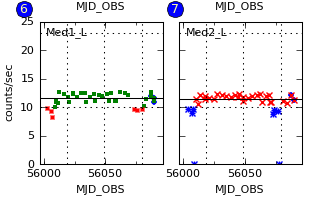
The second panel shows the fluxes for the Medusa1 LR grating. If a certain trend effect is visible in *all* slits, it is likely to be caused by the lamp. If it shows up in one fibre system only, it originates in that particular fibre system. Scoring&thresholds Simultaneous arclamp Thresholds are set such that over-exposure is avoided. The risk of the lamp getting too bright is that bright emission lines might affect the science signal of nearby fibres through cross-talk. This is very much depending on setup (central wavelength), and the upper threshold is set conservatively and empirically. The lower threshold is set such as to detect lamp failures safely. As the FULL plot shows, lamp fluxes have been fairly fluctuating over the years, and also seem to have a seasonal component, all this arguing for a loose and conservative thresholding.
The total lamp flux usually slowly increases with time. It is dimmed electronically when it exceeds a certain threshold, to avoid saturation. This happened in 2004-02, in 2007-03 and again in 2017-11. In the later case, PPRS-070892 collects the related activities. In 2005-07 ... 2005-09, the lamp faded and needed to be stabilized. Algorithm Simultaneous arclamp
One emission line in one of the simultaneous calibration fibres is selected. Its flux is integrated (in counts per sec). This is done by a QC procedure since there is no pipeline recipe.
Flat field lamp (robotic)
The flux of the robotic flat-field lamp is measured in a pattern involving the L543.1 setup in every slit system. A single flat frame is measured. The lightpath between the lamp and the detector also includes interference filters. Hence any effect observed in the efficiency trending could be due to either the lamp or the filter. The parameter giraffe_flat..flattype is either ROB=robotic, or NAS=nasmyth. Here it is always ROB.
Panels of the trending plot:
The lower panel shows the same data, plotted together, to reveal any slit-specific effects.
Plots of spectrally resolved relative fibre transmission can be found here. Scoring&thresholds Flat field lamp (robotic) Upper thresholds both in the FFLAMP and the FFLEVEL reports are motivated by detecting saturation in the flat-fields. The flux value for saturation (for an exposure time fixed in the templates) depends on the setup (central wavelength) and can only loosely be defined in the HC settings. The lower threshold is set empirically to detect lamp failures and compromised flat field quality resulting in insufficient SNR. The QC1 values are averaged across the whole CCD and therefore include both illuminated regions (with the fibre signal) and inter-fibre regions (without a signal).
Algorithm Flat field lamp (robotic) The mean exposure level of the raw file across the whole file is measured (mean_raw) and then divided by the exposure time, the result is the flux and comes in ADU/sec. For historical reasons the calculation is done by the QC procedure.
Nasmyth flat lamp
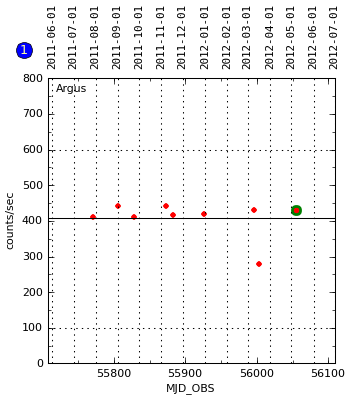
Argus nasmyth flats (flattype=NAS) are acquired everytime the standard star efficiency monitoring is executed (every 1-2 months). Furthermore it may also be triggered by an Argus SCIENCE OB and a standard star exposure. These flats provide a better relative illumination than the robotic flats, so that the relative fibre signal level is more evenly distributed. Nasmyth flats also exist for IFU1 and IFU2 but are so sparsely distributed over time and settings that a trending is impossible. The parameter giraffe_flat..flattype is either ROB=robotic, or NAS=nasmyth. Here it is always NAS.
Box 1 of the trending plot displays the Argus L543.1 values. This setup is used by the Argus STD efficiency monitoring, and also complies with the setup used for the robotic flat lamp monitoring.
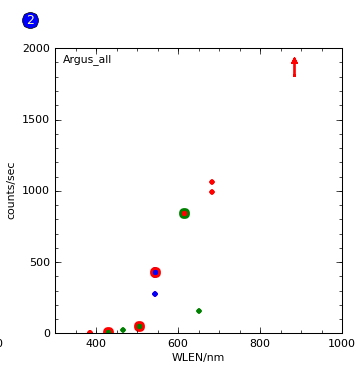
Box 2 in the trending report collects all existing nasmyth lamp data for Argus, to give an indication about the wavelength dependency of the lamp efficiency.
Scoring&thresholds Nasmyth flat lamp In principle the same arguments apply as for the robotic flats. But the Nasmyth flats taken very rarely (with the Nasmyth screen, costly in terms of nighttime or twilight time), as part of Argus science OBs. Therefore there are very few comparison points from the trending, so no scoring, and the thresholds are very loosely defined. The average flux is obtained by dividing the average signal in the first raw file by the EXPTIME.
ARC lamp
The performance of the robotic arc lamp is measured in a pattern involving two settings: the high-resolution H525.8B setup, and the low-resolution L543.1 setup. The former is measured in every slit system, the latter only in the two Medusa's. The pattern repeats every week.
Panels of the trending plot:
The lower panel shows the low-resolution Health Check setting, L543.1, for Medusa1 and Medusa2.
The upper thresholds are motivated by avoiding too high lamp fluxes. Although saturation is not as much an issue as for flat field lamps, the pipeline algorithm will reject saturated emission lines, and the number of accepted lines determines the wavelength calibration quality. With a lamp being too faint, more and more emission lines will be lost in the noise floor, again with the result of a compromised calibration quality. The ideal exposure level is close to the upper limit, but strongly depends on the setting (central wavelength). The thresholds of these HC settings are set to discover lamp flux issues in due time.
The mean exposure level of all emission lines in the raw file is measured and normalized by the exposure time, the result comes in ADU/sec. Note that the signal from the SIMCAL fibres affects the average value as delivered by the pipeline. Therefore the final QC1 value is currently calculated using fibres #2...#10 only. This fibre range is free from SIMCAL signal.
|
|||||||||||||||||||||||||||||||||||||||||||||||||||||||||||||||||||||||||||||||||||||||||||||||||||||||||||||||||||||||||||||||||||||||||||||||||||||||||||||||||||||||||||||||||||||||||||||||||||||||||||||||||||||||||||||||||||||||||||||||||||||||||||||||||||||||||||||||||||||||||||||||||||||||||||||||||||||||||||||||||||||||||||||||||||||||||||||||||||||||||||||||||||||||||||||||||||||||||||||||||||||||||||||||||||||||||||||||||||||||||||||||||||||||||||||||||||||||||||||||||||||||||||||||||||||||
| |
|||||||||||||||||||||||||||||||||||||||||||||||||||||||||||||||||||||||||||||||||||||||||||||||||||||||||||||||||||||||||||||||||||||||||||||||||||||||||||||||||||||||||||||||||||||||||||||||||||||||||||||||||||||||||||||||||||||||||||||||||||||||||||||||||||||||||||||||||||||||||||||||||||||||||||||||||||||||||||||||||||||||||||||||||||||||||||||||||||||||||||||||||||||||||||||||||||||||||||||||||||||||||||||||||||||||||||||||||||||||||||||||||||||||||||||||||||||||||||||||||||||||||||||||||||||||
 |
|
||||||||||||||||||||||||||||||||||||||||||||||||||||||||||||||||||||||||||||||||||||||||||||||||||||||||||||||||||||||||||||||||||||||||||||||||||||||||||||||||||||||||||||||||||||||||||||||||||||||||||||||||||||||||||||||||||||||||||||||||||||||||||||||||||||||||||||||||||||||||||||||||||||||||||||||||||||||||||||||||||||||||||||||||||||||||||||||||||||||||||||||||||||||||||||||||||||||||||||||||||||||||||||||||||||||||||||||||||||||||||||||||||||||||||||||||||||||||||||||||||||||||||||||||||||||