Quality Control and
Data Processing
GIRAFFE: System efficiency
A set of standard star measurements is taken regularly with the Argus IFU of GIRAFFE, under CL (clear) or PH (photometric) conditions, to measure the overall system efficiency. A set of three settings is taken with the low-resolution grating (L427.2, L543.1, L881.7), three more with the high-resolution grating (H447.1A, H651.5B, H875.7). These data are taken once every 1 or 2 months. They are calibrated with the robotic lamp flats. The flats are used only for the localization solution (required for the extraction). Contrary to the usual reduction, the extracted flat-field is not divided into the standard star spectrum, in order to achieve the efficiency curve. The signal from all fibres (excluding SKY and SIMCAL) is summed up and divided by the flux curve of the standard star, to measure the overall (telescope plus optical components plus detector) efficiency of the instrument.
 Efficiency
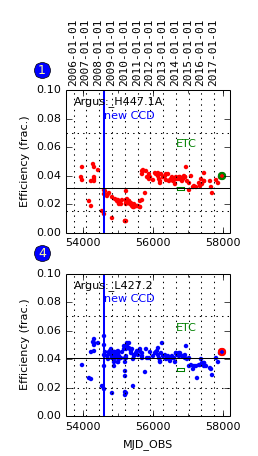
The mean efficiency is plotted in boxes 1-6 of the SYSTEM_EFFICIENCY trending plot for the 6 reference settings (3 HR and 3 LR settings).
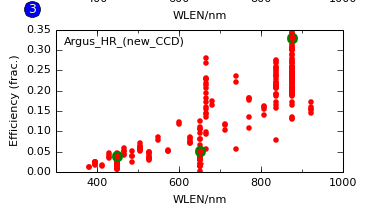
These data are also plotted over wavelength, in the SYSTEM_EFFICIENCY_WLN trending plot .
The trending plot covers the full history of this parameter.
The efficiency is expected to degrade over time, mainly because of the degrading coating of the gratings. The HR grating has been recoated in 2011-06, the effect is visible in plots #1 and #2. Efficiency drops by about -0.0033 per year in H447.1A and in H651.5B. We felt unable to determine a reference value for the two red settings in plots #3 and #6, where the measurement method is particularly bad, due to insufficient sky subtraction in the data. The scoring is quite loose because the definition procedure for mean_effic is not very good. Upper and lower thresholds are only to indicate a possible failure of the routine. The correct interpretation of the results requires looking at the long-term trend. find central wavelength, average the efficiency values in window of 2 nm size around that wavelength, subtract the SKY
|
|||||||||||||||||||||||||||||||||||||||||||||||||||||||||||||||||||||||||||||||||||||||||||||||||||||||||||||||||||||||||||||||||||||||||||||
| |
|||||||||||||||||||||||||||||||||||||||||||||||||||||||||||||||||||||||||||||||||||||||||||||||||||||||||||||||||||||||||||||||||||||||||||||
 |
|
||||||||||||||||||||||||||||||||||||||||||||||||||||||||||||||||||||||||||||||||||||||||||||||||||||||||||||||||||||||||||||||||||||||||||||