Distortion frames are used to determine the spatial distortion on the SINFONI
detector and determine the distances between the individual slitlets. This
calibration is made once per month, as well as immediately following an
intervention. It consists of about 75 FIBRE_NS frames, a FLAT_NS (a
lamp-on/off pair), and a WAVE_NS (arc lamp on/off pair). Each fibre frame
consists of an illuminated fibre imaged along each slitlet position and moved,
from image to image, perpendicularly to the slices. When these frames are
coadded they create uniformly illuminated slits across the full detector (see
Figure below). The arc lamp frames are used to determine the positions of the
edges of each slitlet. The distortions are only obtained at the 25 mas pixel
scale. Due to the inherent stability of SINFONI, the distortions are only
obtained once every 30 days.
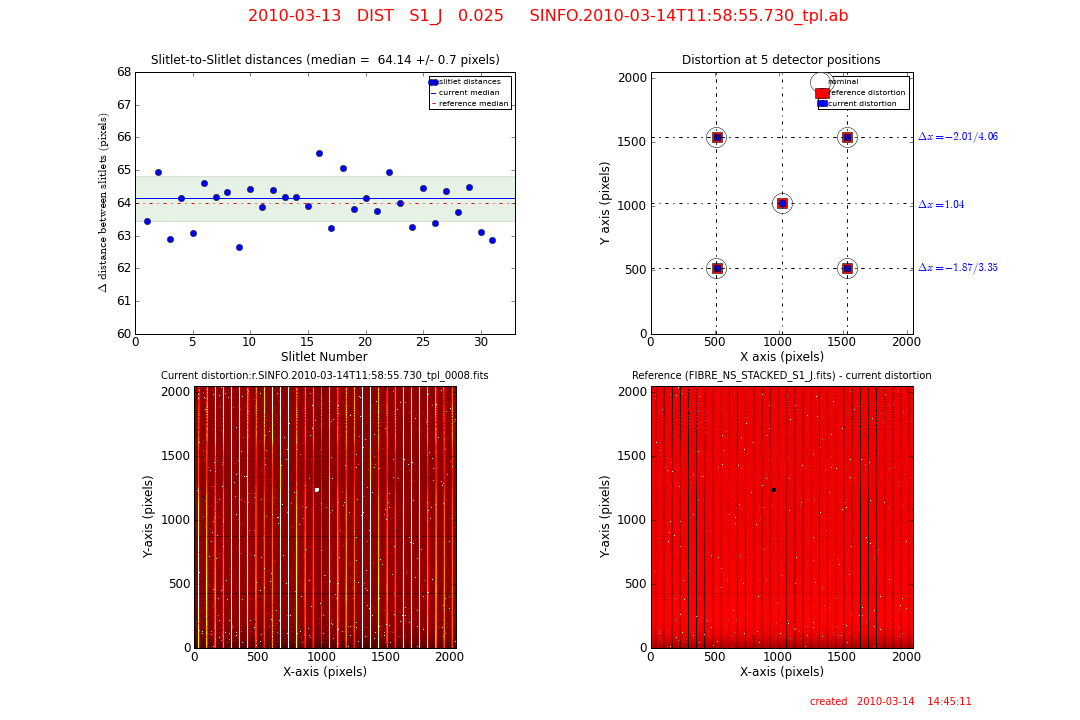
The background-subtracted stack of 75 FIBRE_NS frames. The uniformly illuminated centers of each SINFONI slitlet is clearly visible. The slitlet numbering is shown at the bottom.
To make the effects of changing distortion coefficients more easily visible, the optical distortion is applied to five different positions on the detector. Shown as green dots, these positions are at pixels: (512,512), (512,1536), (1536,512), (1536,1536), and (1024,1024). This is trended in the distortion shifts.
UL: the distance (in pixels) between adjacent slitlets. The 31 distances between slitlets in the current distortion are plotted as blue dots, with their median (blue line) and +/- 1 sigma range (shaded green area) shown. The red dotted line displays the median slitlet distance of a reference distortion.
UR: the distortion coefficients applied to 5 positions on the detector: the chip center and its four quadrants. Black circles depict the nominal values [(512, 512), (1536, 512), (1024, 1024), (512, 1536), (1536, 1536)], the current distortion is shown with blue squares, and the reference distortion is shown as red squares. The difference between the current distortion and the nominal values are printed to the right of the figure (in pixel offsets).
LL: an image of the current distortion.
LR: an image of the difference between the reference and the current distortion.
Based on the inherent stability of the SINFONI optical path, the measurement of the optical distortion has a validity of 20 days. The only potential issue is that the distortion calibration template will, occasionally, produce an incomplete set of frames. This can include either missing FLAT_NS frames, missing FIBRE_NS frames, or frames without flux from the fibre. In these cases the distortion calibration will be repeated when this problem is detected by Garching, QC.
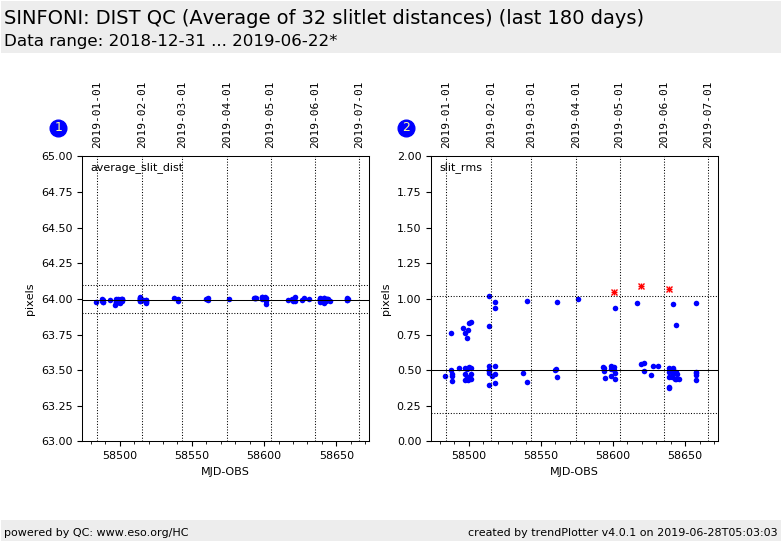
The ~75 frames consisting of a single fibre light source moved perpendicular to the 32 pseudo slit slices are coadded to produce an image with all slits illuminated. The intensity maximum of each column is determined and a least-squares Gaussian fit is performed to locate the fibre's flux and locate the slitlet center. The relative distance between each trace is averagedi(qc.sl.distavg and rms). The distortions are done at the 25 mas pixel scale. The optimal value is 64 pixels.
The distortion function characterizes the curvature of the 32 spectral traces on the coadded fibre images. For each slitlet the centroids of the fibre traces are detected and traced along the curved spectra. Two 2-d numerical grids are constructed; one on the distorted fibre positions and the other on the optimal expected fibre positions. The above 2-d polynomial function is fit to transform the positions from the raw to undistorted coordinates.
The two dimensional polynomial fit to characterize the curvature of the 32 spectral slitlet traces is given by:
distortion(x,y) = C00 + C10*x + C01*y + C11*x*y + C20*x2 + C02*y2 + C21*x2*y + C12*x*y2
Since the distortion coefficients are relatively abstract, the optical distortion is also computed at five positions on the detector.
 Parameters trended