Quality Control and
Data Processing
|
SINFONI: PSF
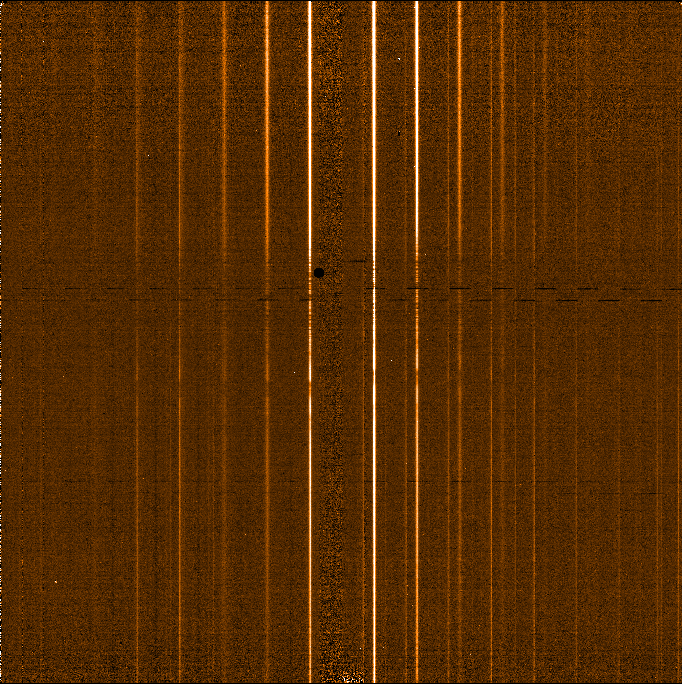
PSF standard stars are not part of the general SINFONI calibration plan, but must be explicitly requested for a given programme by the PI. They can be used to define the PSF of the image and characterize any variation as a function of wavelength through the SINFONI data cube. In some cases, particularly when observing very faint science sources, the PSF star template is used as an offset position check. The PSF star data is processed with the same pipeline routine as is used for science frames. The PSF star products are stand-alone deliverables (i.e. no PSF correction or convolution is applied to the science data).
 Parameters trended
QC Report 1: QC Report 2:
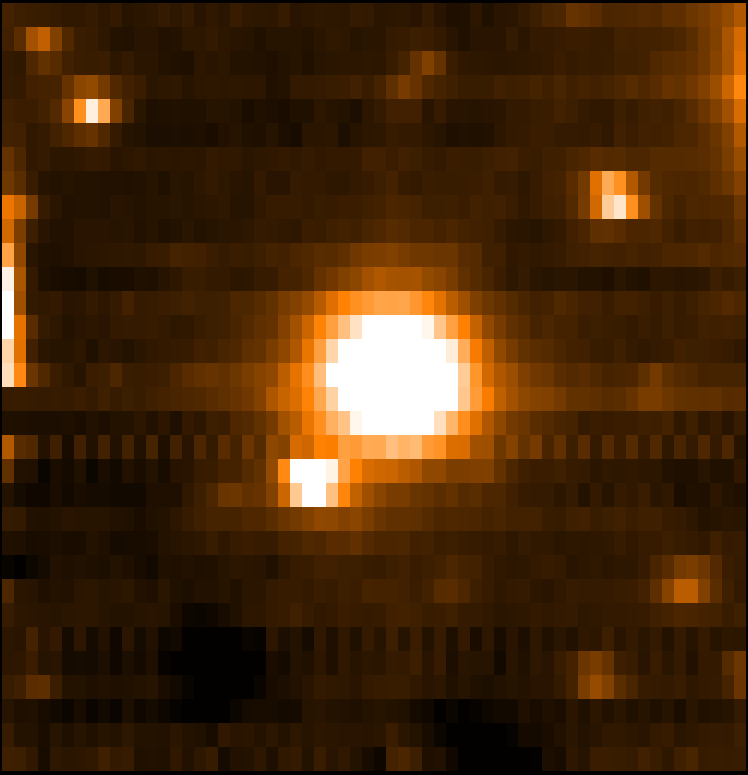
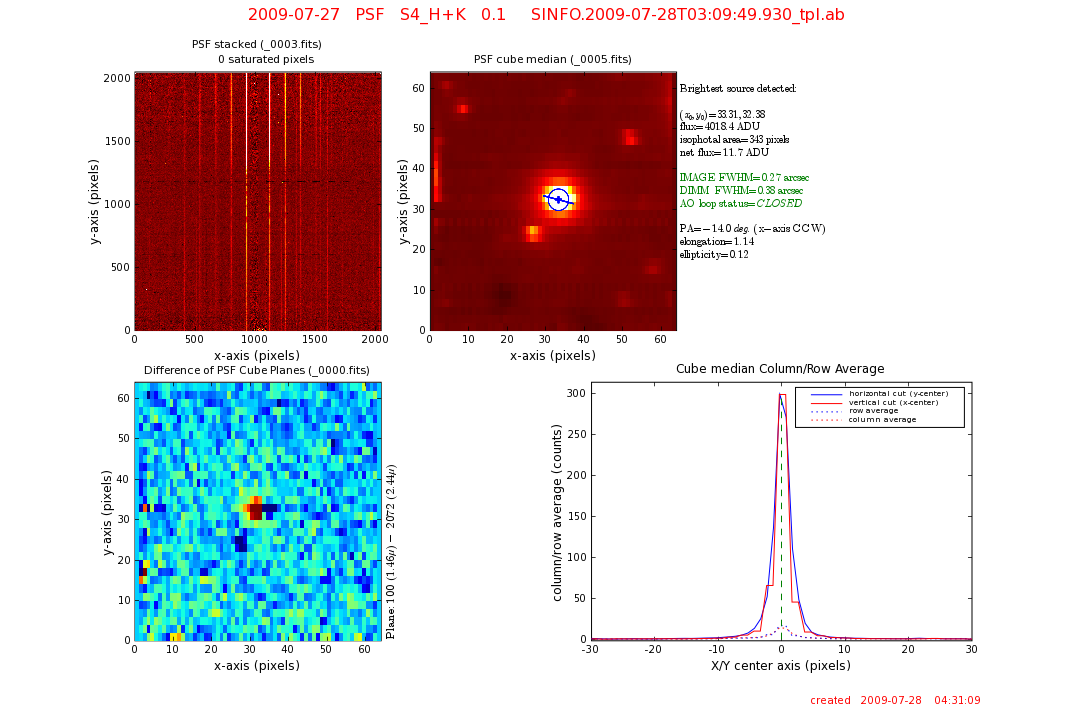
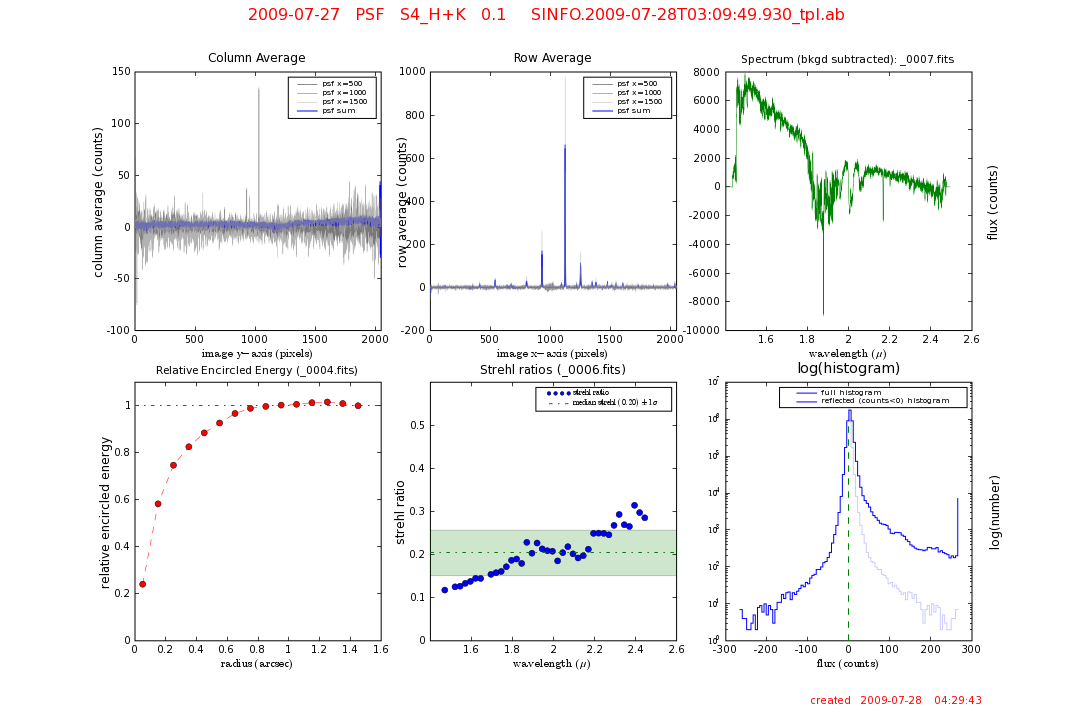
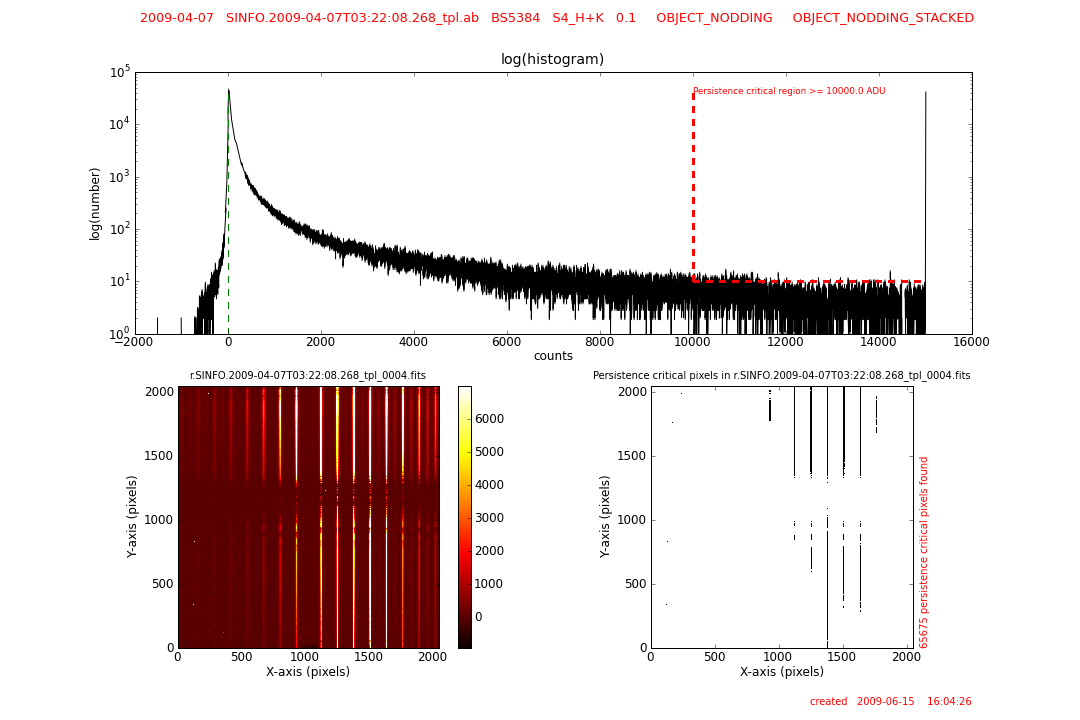
QC Report 3 Scoring&thresholds Parameters trended A minimum flux is needed for the telluric standard star, if this flux is not reached, the observation is repeated with a longer DIT. The number of counts is also monitored to detect any danger of persistence. A minimum flux is needed for the telluric standard star, if this flux is not reached, the observation is repeated with a longer DIT. The number of counts is also monitored to detect any danger of persistence. SExtractor (Bertin and Arnouts 1996 A&A 117,393) is run on the MED_COADD_PSF frame and the brightest detected source is assumed to be the PSF. The total flux integrated over a 3 sigma detection aperture is divided by the number of pixels in this aperture. This "net" flux per pixel is monitored for all filters and pixel scales. Values above 5 ADU/pixel are considered acceptable. For each plane (wavelength step) in the COADD_PSF cube the pipeline computes the strehl ratio of the PSF star. The median value over all cube planes is monitored for all filters and pixel scales. test for over-flux A histogram is created from the PSF_NODDING_STACKED image. If there are more than 10 instances of 6 or more contiguous pixels having count levels above 10,000 ADU, then this frame is in danger of persistence. In this case qc.persist.danger = 1, otherwise it is set to 0. If a danger of persistence is detected, the number of affected pixels is also given (qc.Npersist). image quality (J-band) The nominal center of the PSF star image is computed from the frame size: x0 = nx/2; y0 = ny/2 Based on the position of the PSF star (as detected by SExtractor in the QC script QCsinfo_psf.py) (x, y) the radial offset to the frame center is computed as: qc_center_offset = sqrt[ (x-x0)^2 + (y-y0)^2 ]. This is important since the PSF star is often used as a positioning test when faint science observations are made. The QC_script then calculates a Delta_IQ = sinfoni telluric standard star FWHM - DIMM seeing (whereby the DIMM seeing has been adjusted to the wavelength and airmass of the standard star observation). The image quality (IQ) plot shows the FWHM of the PSF star and the corrected DIMM plotted against one another. CLOSED loop (AO) observations are plotted as solid circles, while OPEN loop (non-AO) observations are shown as open circles (J-band with all pixel scales). NOTE: The conversion from pixels to arcsec for the image FWHM takes into account the fact that the reconstructed SINFONI cube has rectangular pixels. The reconstructed pixels are such that on-sky Delta_X = 0.5*Delta_Y. The correct conversion, in terms of the source position angle (PA), is:
pixel_scale is given by the keyword INS.OPTI1.NAME
|
|||||||||||||||||||||||||||||||||||||||||||||||||||||||||||||||||||||||||||||||||||||||||||||||||||||||||||||||||||||||||||||||||||||||||||||||||||||||||||||||||||||||||||||||||||||||||||||||||||||||||||||||||||||||||||||||||||||||||||||||||||||||||||||||||||||||||||||||||||||||||||||||||||||||||||||||||||||||||||||||||||||||||||||||||||
| |
||||||||||||||||||||||||||||||||||||||||||||||||||||||||||||||||||||||||||||||||||||||||||||||||||||||||||||||||||||||||||||||||||||||||||||||||||||||||||||||||||||||||||||||||||||||||||||||||||||||||||||||||||||||||||||||||||||||||||||||||||||||||||||||||||||||||||||||||||||||||||||||||||||||||||||||||||||||||||||||||||||||||||||||||||||
 |
|
|||||||||||||||||||||||||||||||||||||||||||||||||||||||||||||||||||||||||||||||||||||||||||||||||||||||||||||||||||||||||||||||||||||||||||||||||||||||||||||||||||||||||||||||||||||||||||||||||||||||||||||||||||||||||||||||||||||||||||||||||||||||||||||||||||||||||||||||||||||||||||||||||||||||||||||||||||||||||||||||||||||||||||||||||||