This tutorial provides information for the BIAS Health Check trending. It is based on the measurement of QC1 parameters of BIAS calibration data obtained with dedicated Health Check OBs executed daily. These OBs obtain four sets of BIAS data, 2 sets in BLUE mode and 2 sets in RED mode, each set comprising 5 RAW frames. The 2 sets in each mode are acquired in the two main CCD ReadOut modes:; 225kHz, low gain, 1x1 and 50kHz, high gain, 2x2.
These data thus give detailed charateristics for all THREE UVES CCDs, one BLUE and two RED (UPPER and LOWER).
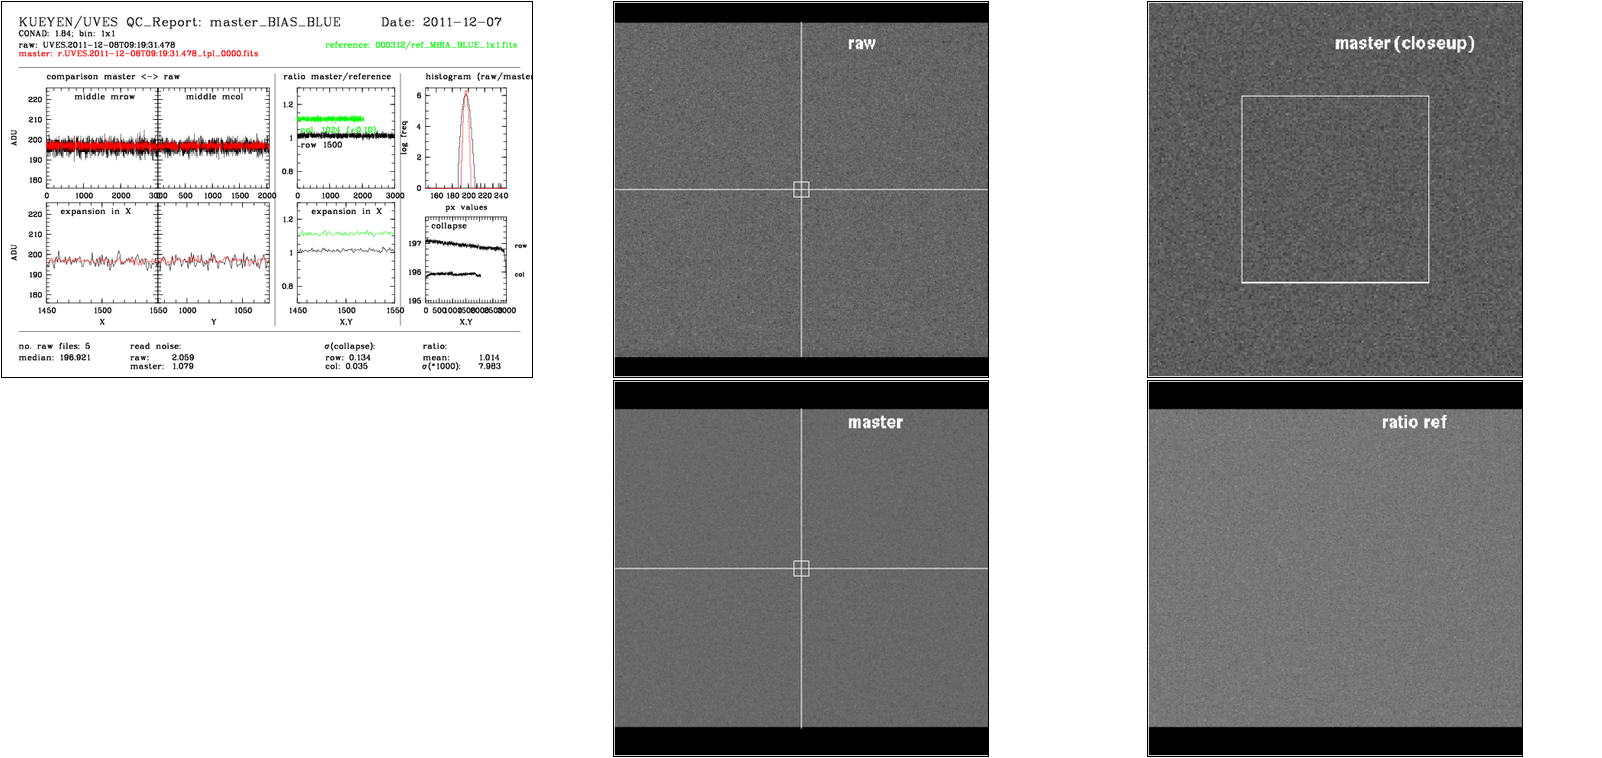
Left, box 1: comparison master (red) <-> raw (black); middle row and middle column, full pixel range, in ADU
Left, box 2: comparison master (red) <-> raw (black), expansion in x; middle row and middle column, central 100 pixels, in ADU
Left, box 3: ratio master/reference; central row for all columns (black) in ADU; central column for all rows (green) in ADU, offset for clarity by +0.10
Left, box 4: ratio master/reference; central row for central 100 columns (black) in ADU; central column for central 100 rows (green) in ADU, offset for clarity by +0.10
Left, box 5: histogram: all pixel values in log frequency histogram; raw: black, master: red; there should be a dominant peak with Gaussian shape (which translates to parabola shape in this log freq diagram)
Left, box 6: structure description; all columns and all rows are collapsed and then all rows (top) and all columns (bottom, offset by -0.10 for clarity) are displayed;
Left, top panel: name of analyzed master bias frame, along with the name of the first RAW, the reference used etc
bottom panel: some QC1 parameters (median_master; raw RON, master RON, expected RON=raw/sqrt(5), structure parameters)
Right, top 1: full display of raw frame
Right, top 2: full display of master frame (box: area to be displayed in bias_blue_0000.fits_3.png)
Right, lower 1: closeup display of master frame
Right, lower 2 : full display of master frame minus reference frame
median_master: Exact median of the pixel values of master bias (all pixels taken into account), product keyword PRO.DATAMED
sigma_raw: RON (in ADU) value of first raw frame, product keyword QC.OUTi.RON.RAW
sigma_master: RON (in ADU) value of master bias, product keyword QC.OUTi.RON.MASTER
struct_row: structure in X/Y direction, product keyword QC.OUTi.STRUTX/Y Evidence of any possible structure in bias. To have more details on a bias image without saving the full image we collapse it along X or Y and compute the standard deviation of the corresponding point distribution. This is the STRUCTX/Y. A large or suddenly changed value of the structure is indication of some problem on the axis ortogonal to the direction of collapsation.
mean_ratio_ref: ratio to reference frame, this QC parameter is currently calculated by the QC report script, not by the pipeline. The ratio image rel_ref to the reference is computed by a simple division of the MASTER by the REFERENCE, mean_ratio_ref is then computed as the mean value (i.e. outputr(3)) returned by the following MIDAS command:
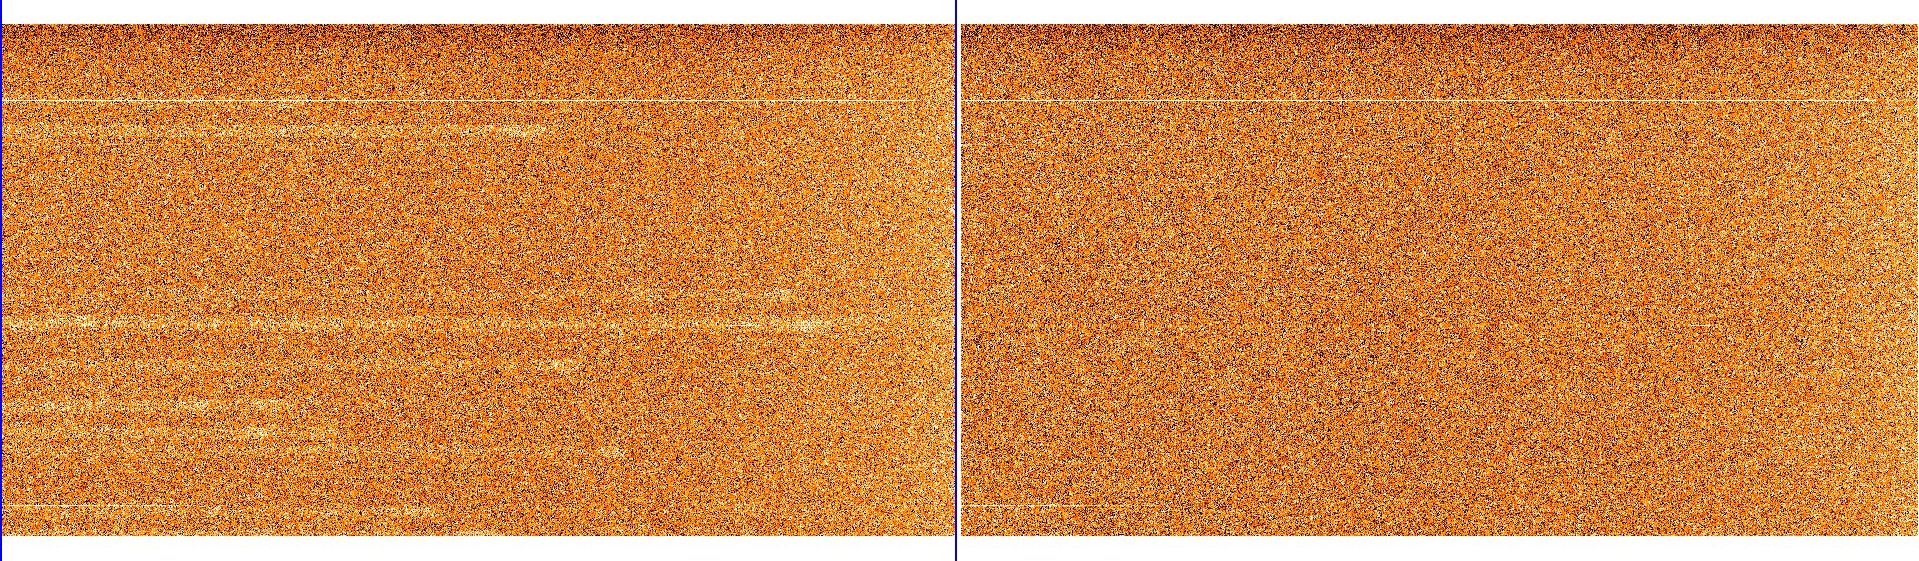
Structure
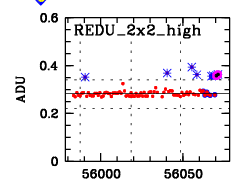
From time to time, there appear outliers in the HC plot #6 "Struct_Y". These are due to remnants left by previous arc observations. Arcs taken in 760-860nm settings are known to leave this kind of remnances. Usually such master_bias frames should be rejected, only good ones should be associated to science frames.
The trending of the Structures in the BIAS during the life time of the instrument is best be seen with the full history BIAS trending plots shown here: FULL STRUCTY history.
struct_row: structure in X/Y direction, product keyword QC.OUTi.STRUTX/Y Evidence of any possible structure in bias. To have more details on a bias image without saving the full image we collapse it along X or Y and compute the standard deviation of the corresponding point distribution. This is the STRUCTX/Y. A large or suddenly changed value of the structure is indication of some problem on the axis ortogonal to the direction of collapsation.
 BIAS Parameters