Quality Control and
Data Processing
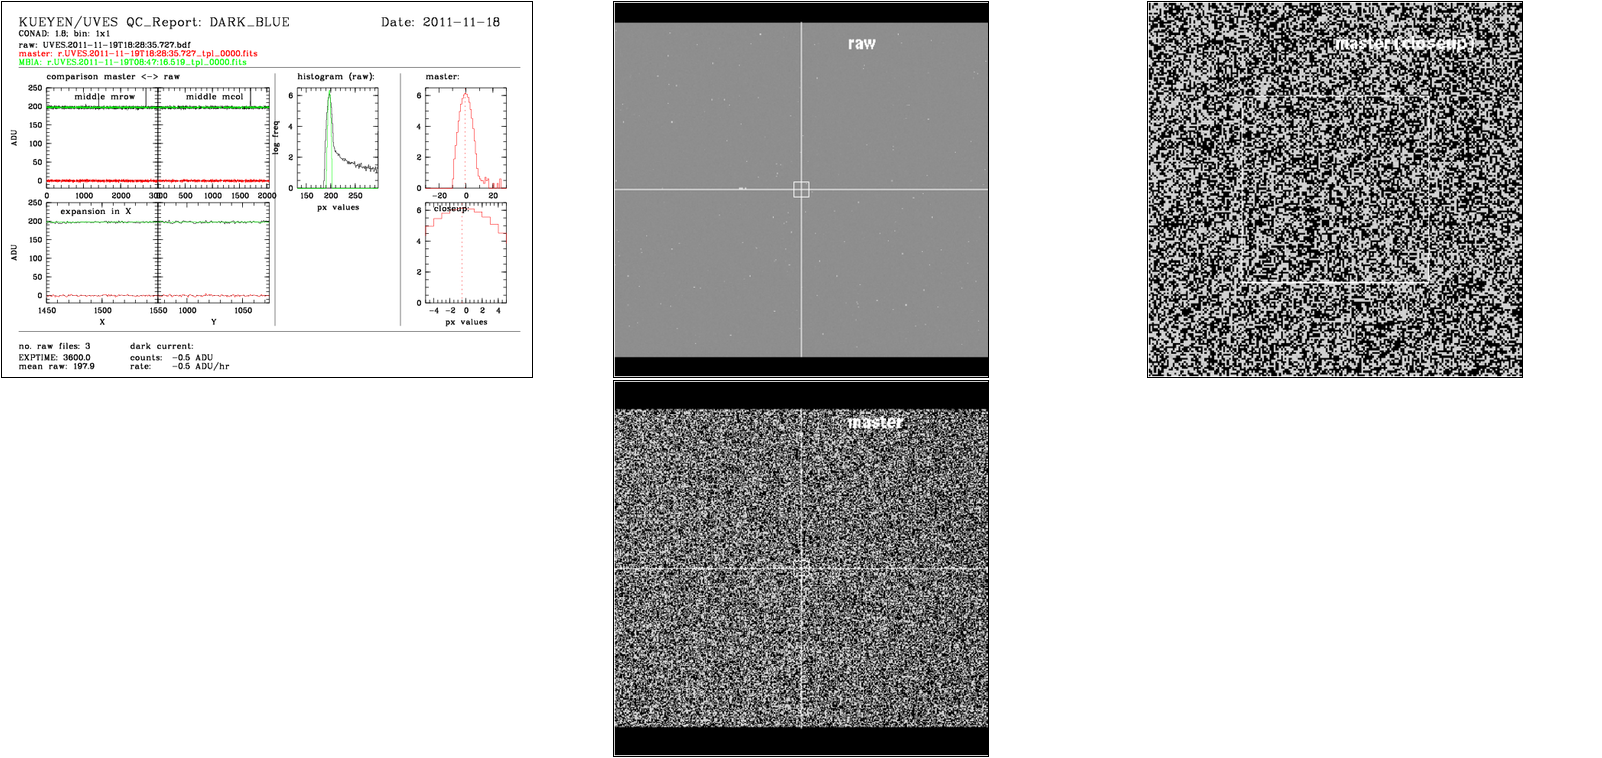
UVES: Detector monitoring
The detector trending is based on the measurement of QC1 parameters of DARK and Detector Linearity data. It is obtained with dedicated Health Check OBs executed approximately monthly. The DARK OBs obtain 4 sets of DARK data, 2 sets in BLUE mode and 2 sets in RED mode, each set comprising three 3600 second RAW frames. The 2 sets in each mode are acquired in the two main CCD ReadOut modes; 225kHz, low gain, 1x1 binning amd 50kHz, high gain, 2x2 binning. The Detector Linearity OBs obtain 4 sets of BIAS and Imaging Flat Field data, 2 sets in BLUE mode and 2 sets in RED mode, each set comprising five BIAS RAW frames and ten pairs of Flats with exposures times for each pair selected to sample the full well potential of the detector. The 2 sets in each mode are acquired in the two main CCD ReadOut modes; 225kHz, low gain, 1x1 binning amd 50kHz, high gain, 2x2 binning. These data thus give detailed charateristics for all THREE UVES CCDs, one BLUE and two RED (UPPER and LOWER).  DARK parameters
These frames are taken approximately once per month, as a set of 3 consecutive exposures of 3600 secs each. These data are de-biased and combined into a MASTER_DARK, in which the average dark level is measured (in ADU/px/hr). You can also see here basic QC parameters related to detector properties (like median level, ReadOut Noise, etc). Scoring&thresholds DARK parameters The thresholds are set as an offset around the median. The user manual gives an indication of the values. These are given in e-/pix/h (ADU/pix/h) at -120C:
The trending of the DARK during the life time of the instrument is best be seen with the full history DARK trending plots shown here: FULL DARK history. All the parameters are calculated by a QC script
Linearity-Gain parameters
These frames are taken approximately once per month, as a set of 25 consecutive exposures, 5 BIAS frames and 10 pairs of FLATs of varying exposure time and thus various signal level designed to sample the full dynamic range of the detector. Scoring&thresholds Linearity-Gain parameters Scoring thresholds have been set rather losely . The trending of the LINEARITY during the life time of the instrument is best be seen with the full history LINEARITY trending plots shown here: FULL Linearity history. Algorithm Linearity-Gain parameters The recipe detmon_opt_lg is part of the detector monitoring recipes common to several VLT instruments. Frames ON are considered as FLAT and OFF as BIAS frames.
the QC.LIN_EFF parameter is the difference between the polynomial flux (3rd order) and the predicted linear fit at a user defined flux level (10000) normalized with the polynomial flux.
|
|||||||||||||||||||||||||||||||||||||||||||||||||||||||||||||||||||||||||||||||||||||||||||||||||||||||||||||||||||||||||||||||||||||||||||||||||||||||||||||||||||||||||||||||||||||||||||||||||||||||||||||||||||||||||||||||||||||||||||||||||||||||||||||||||||||
| |
|||||||||||||||||||||||||||||||||||||||||||||||||||||||||||||||||||||||||||||||||||||||||||||||||||||||||||||||||||||||||||||||||||||||||||||||||||||||||||||||||||||||||||||||||||||||||||||||||||||||||||||||||||||||||||||||||||||||||||||||||||||||||||||||||||||
 |
|
||||||||||||||||||||||||||||||||||||||||||||||||||||||||||||||||||||||||||||||||||||||||||||||||||||||||||||||||||||||||||||||||||||||||||||||||||||||||||||||||||||||||||||||||||||||||||||||||||||||||||||||||||||||||||||||||||||||||||||||||||||||||||||||||||||