This tutorial provides information for the FLAMES-UVES grating position.
It is based on the measurement of QC1 parameters of MOS FORMAT CHECK calibration data.
There are three sets of MOS FORMAT CHECK data, 1 set in each of the three wavelength settings available in MOS mode (520.0, 580.0 and 860.0nm), each set comprising a single RAW frame.
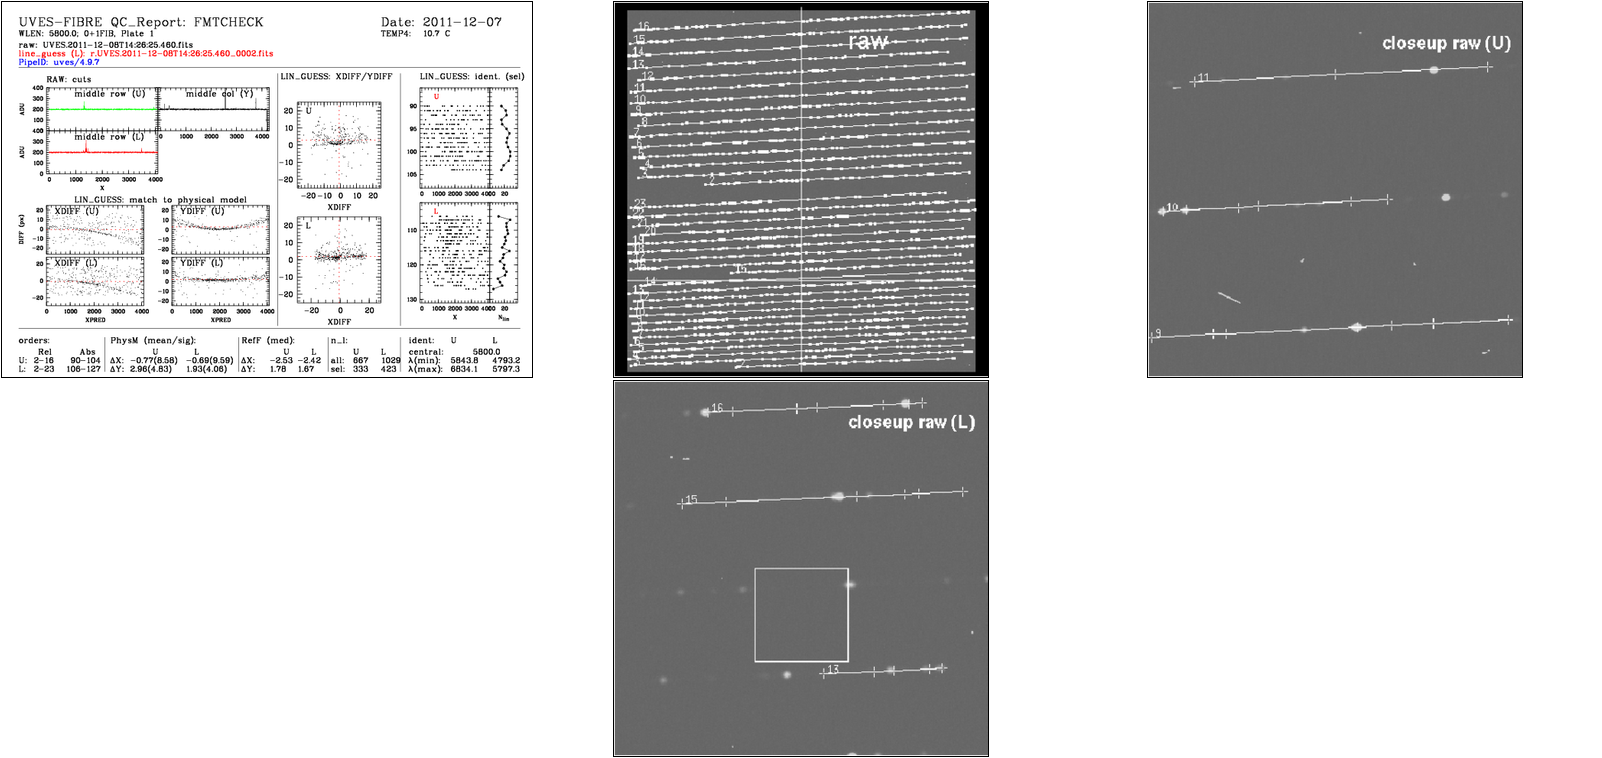
plot 1:trace across the central row of the RAW frame of the UPPER chip
plot 2:trace across the central row of the RAW frame of the LOWER chip
plot 3:trace across the central column of the RAW frame
plot 4:XDIFF vs YDIFF plot for the UPPER chip, where XDIFF & YDIFF are the differences between the measured positions of each line and the positions expected from the physical model. Ideally the points in this plot should cluster about 0,0, but the pipeline seems capable to cope with deviations of upto -10,+10 in both axes (the pipeline developer expects 'problems' at values much larger than +/-10 however this range has not been 'explored' in normal operations). Jumps (of completely unpredicatable nature) are often seen in these parameters due to earthquakes and any other influence (e.g. maintenance/intervention operations) which 'disturb' the instrument. Jumps in BLUE and RED arms can be completely UNCORRELATED.
plot 5:Distribution of located lines by echelle order for the UPPER chip, plus number of lines per order
plot 6:XDIFFs (as above) as a function of position along each order for the UPPER chip
plot 7:XDIFFs (as above) as a function of position along each order for the LOWER chip
plot 8:YDIFFs (as above) as a function of position along each order for the UPPER chip
plot 9:YDIFFs (as above) as a function of position along each order for the LOWER chip
plot 10:XDIFF vs YDIFF plot for the LOWER chip, where XDIFF & YDIFF are the differences between the measured positions of each line and the positions expected from the physical model. Ideally the points in this plot should cluster about 0,0, but the pipeline seems capable to cope with deviations of upto -10,+10 in both axes (the pipeline developer expects 'problems' at values much larger than +/-10 however this range has not been 'explored' in normal operations). Jumps (of completely unpredicatable nature) are often seen in these parameters due to earthquakes and any other influence (e.g. maintenance/intervention operations) which 'disturb' the instrument. Jumps in BLUE and RED arms can be completely UNCORRELATED.
plot 11:Distribution of located lines by echelle order for the LOWER chip, plus number of lines per order
Only the OzPoz plate1 is used for scoring. The plate 2 is monitored.
Scoring thresholds have been set around the median position.
Calibrating SCIENCE observations made during the night with calibrations taken during the day relies on the stability and reproducibility of the positioning of the instrument components. To insure an accurate wavelength calibration, one of the critical criteria is the accuracy of the positioning of the gratings. If the highest possible accuracy is required for the wavelength calibration, an attached wavelength calibration should be taken with the science. Alternatively, since the exact grating position can not be measured in the science image itself, we rely on the daily health check format check data to verify the stability and reproducibility from day to day, assuming that this is a reaasonable indication of the reproducibility between nighttime science and daytime calibrations.
With this in mind the important aspects in these plots are the day to day scatter. The absolute level, within reason (i.e. plus or minus 10 pixels) is not important. From time to time there are sudden jumps in the mean levels, often due to earthquakes, but often the cause of the jump is far from obvious. Such jumps are not in themselves a cause for immediate concern. Only if they are happening frequently, and liable to be happening during the night. Or if they take the instrument so far from the Physical Model that the pipeline will have serious difficulties to converge to a solution, as a rule of thumb, intervention to realign should be considered if the residuals exceed plus or minus 10 pixels.
The trending of the FMTCHK during the life time of the instrument is best be seen with the full history FMTCHK trending plots shown here: FULL FMTCHK history.
mean_dx, mean_dy, sigma_dx, sigma_dy: The physical model used in Formatcheck step allows to measure the difference between model predicted and detected line positions. This is useful to verify precision of physical model prediction and instrument spectral format stability. the parameters mean_dx/y represent the difference of X/Y positions to physical model, the sigma : the rms of difference to the physical model
median_shftx, median_shfty: median of difference in X to reference frame (stability check)
nlin_all: The physical model used in the Formatcheck step allows to predict line positions on the formatcheck frame. This is the total number of predicted matching lines.
nlin_sel: The physical model used in the Formatcheck step allows to predict line positions on the formatcheck frame. The selected number of lines is the subset of the total number of lines which fall in the physical model plot limits.
 Grating Position (FMTCHK) parameters