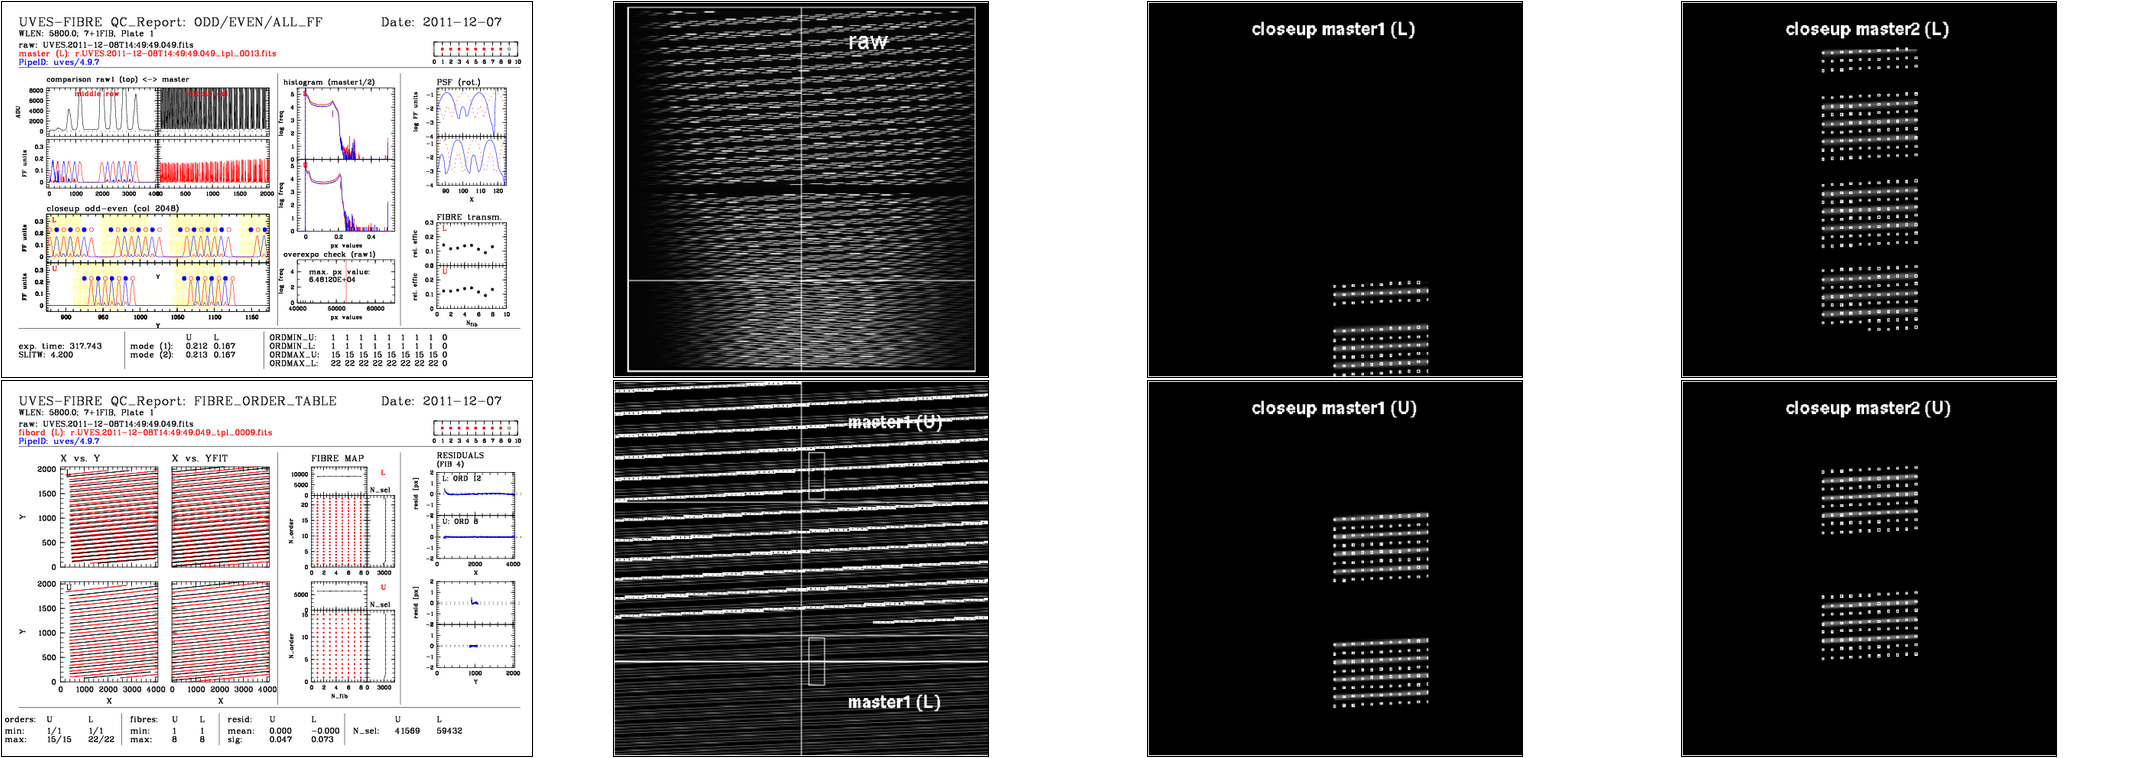
The monitoring of the MOS calibration lamps is based on FIBRE (MOS) FLAT and WAVE calibration data. These data come in the 7+1 Fibre mode, 580 nm MOS setting using Plate 1. QC1 parameters for all eight fibres are collected and monitored, but only fibre 4 is used for scoring.
These data are also used to monitor the status of the Fibres.
Since 2012-09-09 there is a broken fiber in all the Plate 2 MOS settings.
plot 1:trace across the middle row of the RAW frame (black) and the MASTER_[E|D|T]FLAT_BLUE (red), the master flats are background subtracted and normalised to a 1sec exposure time hense the different signal level.
plot 2:trace across the middle column of the RAW frame (black) and the MASTER_[E|D|T]FLAT_BLUE (red)
plot 3:trace across the middle row of the MASTER_[E|D|T]FLAT_BLUE (red), as in plot 1 but at a different (not necessarily well adjusted for all MODE/WL/BINNING settings) scale
plot 4:trace across the middle column of the MASTER_[E|D|T]FLAT_BLUE (red), as in plot 2 but at a different scale
plot 5:Y-collapsed derivX: row averaged trace of the central region of the derivX image WITHOUT masking of the inter-order space
plot 6:X-collapsed derivY: column averaged trace of the central region of the of the derivY image WITH masking of the inter-order space
plot 7:difference raw21: trace across the central row (zooming on the central 100 pixels) of the diff21_mask (difference of first and second frames with inter-order space pixels 'masked to -10,000) frame
plot 8: trace across the central column (zooming on the central 100 pixels) of the diff21_mask frame
box 2, left to right, top to bottom:
plot 9:shift mcol/ref: shift of the current master flat (black) with respect to the reference master flat (green, ref_MSFE*.fits in $DFO_CAL_DIR/refs with matching wavelength, binning and INS.PATH (BLUE, RED, DICHR#1 or DICHR#2))
plot 10:correlation mcol/ref: cross correlation function between the current master flat and the reference master flat (as above) to visualize acurrately the offset between the two.
plot 11:overexpo check (raw): visual check for over exposure in the first RAW frame, histogram of pixel values.
box 3, left to right, top to bottom:
plot 12:histogram (raw/master): pixel value histograms of the first raw frame (black) and master flat (red), close up on low ADU values (left) and full range (right) plot 13:raw2-raw1: sigma_ph: histograms of the diff21 (black, direct difference of first and second frames) and diff21_mask (red) frames, the black "bump" above the red histogram thus represents the inter-order pixels. The overploted blue gaussian line is simply the gaussian derived from the mean and standard deviation values computed by MIDAS stat/imag command of the diff21_mask frame. plot 14:sigma_DX/sigma_DY: histograms of the derivX (top) and derivY (bottom) frames with overplotted gaussians derived from the mean and standard deviation values computed by MIDAS stat/imag command of the derivX & derivY frames.
resid_min, resid_max, resid_mean, resid_sigma : we check residual in order def step to check if the geometrical spectral format predicted from the physical model match the actual detected spectral format (which may contain less orders due to unsufficient detector illumination).
npos_all: total number of positions found (per fibre). We check in the order def step if the geometrical spectral format predicted from the physical model match the actual detected spectral format (which may contain less orders due to unsufficient detector illumination). This number give a more detailed information on the overal order detection (respect to QC NPRED and QC NALL)
npos_sel: number of positions selected (per fibre)
fib_min,fib_max:minimum and max fibre ID found, this is calculated by a QC script
Description: TBD
fib_effic_rel: relative transmission (efficiency) measured on each fibre
fib_effic_abs: absolute transmission (ADU/sec) of each fibre
 Fibre Flat Lamp (MOS) Parameters