UVES: ECH Wavelength solution and resolution
| |
| HC PLOTS |
| Echelle Resolution |
 |
| wave parameters BLUE 437 |
|
| wave parameters BLUE |
|
| wave parameters REDU 580 |
|
| wave parameters REDL 580 |
|
| wave parameters REDU |
|
| wave parameters REDL |
|
| Thermal |
|
| Wave with derotator angle |
|
|
QC1 database (advanced users):
browse |
plot
|
We calculate the wavelength solution and measure the quality of the wavelength calibration solution. It is based on QC1 parameters of two sets of WAVECAL data, 1 set in BLUE mode and 1 set in RED mode, each set comprising a single RAW frame. Depending of wavelength setting ,the data are recorded every day or on another time scale.
An additional measurement is performed on a regular basis to monitor the stability and the accuracy of the wavelength solution as a function of the derotator angle.
 Parameters trended
QC1_parameters
| FITS key |
QC1 database: table, name |
definition |
class* |
HC_plot** |
more docu |
| QC.WLENMAX | uves_wave..lambda_max | maximum wavelength [Angstrom] | HC | | [docuSys coming] |
| QC.WLENMIN | uves_wave..lambda_min | minimum wavelength [Angstrom] | HC | | [docuSys coming] |
| QC.ORDMIN.DETECTED | uves_wave..order_min_det | minimum order number DETECTED | HC | | [docuSys coming] |
| QC.ORDMAX.DETECTED | uves_wave..order_max_det | maximum order number DETECTED | HC | | [docuSys coming] |
| QC.LINE.RESIDAVG | uves_wave..resid_avg | mean residual of line positions to fit [milli-Angstrom] | HC | | [docuSys coming] |
| QC.RESOLRMS | uves_wave..resol_rms | sigma of resolving power of lines selected | HC | | [docuSys coming] |
| QC.LINE.RESIDRMS | uves_wave..resid_rms | sigma of residual of line positions to fit [milli-Angstrom] | HC | | [docuSys coming] |
| QC.RESOLMED | uves_wave..resol_med | median resolving power of lines selected | HC | | [docuSys coming] |
| QC.INTAVG | uves_wave..int_avg | average intensity of ThAr lines (divided by EXPTIME) | HC | | [docuSys coming] |
| QC.FWHMMED | uves_wave..fwhm_med | median FWHM in X of lines selected | CAL | | [docuSys coming] |
| QC.NLINTOT | uves_wave..nlin_tot | total number of lines found in LAST iteration | HC | | [docuSys coming] |
| QC.NLININT | uves_wave..nlin_int | number of lines selected in ThAr intensity check | HC | | [docuSys coming] |
| QC.NLINSOL | uves_wave..nlin_sol | number of lines used in solution | HC | | [docuSys coming] |
*Class: KPI - instrument performance; HC - instrument health; CAL - calibration quality; ENG - engineering parameter
**There might be more than one. |
Trending
 |
Montage of the different QC reports
|
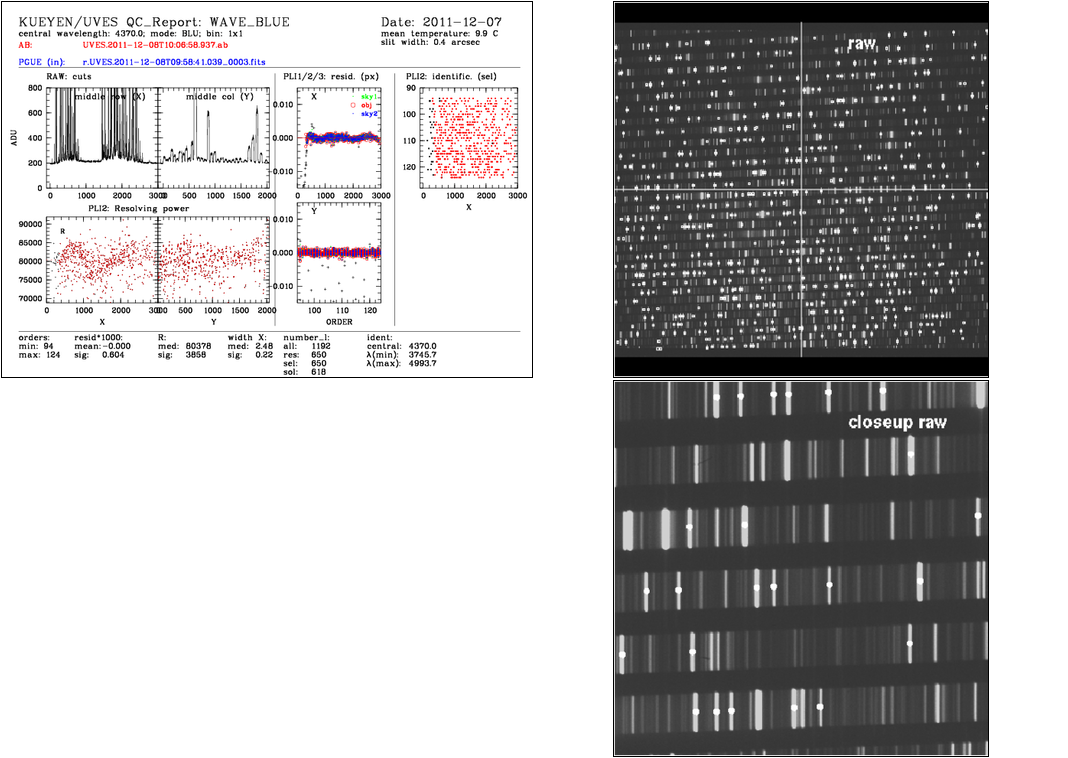
The montage displays:
box 1, left to right, top to bottom:
plot 1:trace across the middle row of the RAW frame
plot 2:trace across the middle column of the RAW frame
plot 3:measured resolving power of each line used in the solution as a function of X
plot 4:measured resolving power of each line used in the solution as a function of Y
box 2, top to bottom:
plot 5:residuals of measured line positions with respect to the physical model for the order centre (red open circles) and the two so-called sky traces (one on either side of the central trace) (green and blue crosses) as a function of X pixels coordinate
plot 6:residuals of measured line positions with respect to the physical model for the order centre (red open circles) and the two so-called sky traces (one on either side of the central trace) (green and blue crosses) as a function of Y pixels coordinate
box 3, top to bottom:
plot 7:representation of found but not used (black) and found and used (red) in the solution lines as a function of order
The minimum wnd maximum avelength of the solution changes of a few nm usually occur because of changes in the last detected line, which often happens when the position of the orders changes slightly (see Grating Position trending). Changes of tens-hundreds of nm are usually due to the pipeline failing to locate entire orders.
Scoring&thresholds Parameters trended
Scoring thresholds have been set to be the ones indicated in the user manual.
| INS.MODE | Cross_disperser | WL_min | Central_WL | WL_max | gap between REDL and REDU |
| DIC1 | CD1 | 303 | 346 | 388 | na |
| DIC1 | CD2 | 326 | 390 | 445 | na |
| DIC1 | CD3 | 458 | 564 | 668 | 2 |
| DIC1 | CD3 | 476 | 580 | 684 | 5 |
| DIC2 | CD1 | 303 | 346 | 388 | na |
| DIC2 | CD2 | 326 | 390 | 445 | na |
| DIC1 | CD3 | 476 | 580 | 684 | 5 |
| DIC2 | CD1 | 303 | 346 | 388 | na |
| DIC2 | CD2 | 326 | 390 | 445 | na |
| DIC2 | CD2 | 373 | 437 | 499 | na |
| DIC2 | CD4 | 565 | 760 | 946 | 7 |
| DIC2 | CD4 | 660 | 860 | 1060 | 10 |
| blue | CD1 | 303 | 346 | 388 | na |
| blue | CD2 | 373 | 437 | 499 | na |
| red | CD3 | 414 | 520 | 621 | 1 |
| red | CD3 | 476 | 580 | 684 | 5 |
| red | CD3 | 500 | 600 | 705 | 5 |
| red | CD4 | 660 | 860 | 1060 | 10 |
Here we show the values given by the ETC:
| WL_min | Central_WL | WL_max |
| 302 | 346 | 388 |
| 326 | 390 | 452 |
| 373 | 437 | 500 |
| WL_min(L) | WL_max(L) | Central_WL | WL_min(U) | WL_max(U) |
| 414 | 521.37 | 520 | 521.6 | 621 |
| 458 | 564.4 | 564 | 565.5 | 667 |
| 473 | 580.36 | 580 | 581.82 | 683 |
| 496 | 597.26 | 600 | 599.11 | 707 |
| 575 | 747.15 | 760 | 766.07 | 946 |
| 665 | 854.39 | 860 | 864.59 | 1060.57 |
History
The trending of the Wave parameters during the life time of the instrument is best be seen with the full history trending plots shown here: FULL history.
Algorithm Parameters trended
resid_avg, resid_rms: mean and sigma of the line positions to fit. These parameters are useful to check precision of wavelength calibration solution.
resol_med, resol_rms: measured median iand sigma of the resolving power of lines selected
fwhm_med, fwhm_rms: measured median and sigma FWHM in X of lines selected
nlin_tot: total number of lines found
nlin_res: Number of lines with residual < 0.1 nm. This number gives an idea of the precision of the final solution. The higher the number the more precise is the solution.
nlin_sel: number of lines selected which could be cross-identified with the catalogue
nlin_sol: number of lines identified and accepted for determining the final wavelength calibration solution
nlin_tot_1stiter: The Pipeline automatically adjusts the line detection threshold iteratively until it detects a number of lines between the --minlines and --maxlines command line parametres of the recipe. This is the number of lines detected in the FIRST iteration, and so is less sensitive to pipeline artifacts
nlin_niter is the number of lines used threshold adjustment iterations required to arrive at final solution
nlin_int: number of lines selected in ThAr intensity check
int_avg: average intensity of ThAr lines (divided by EXPTIME) of the selected line list.
~
|
