Plot
? |
Symb
? |
Source
* |
Average ? |
Thresholds ? |
N_
data |
QC1
parameter |
Data
downloads |
Remarks |
| method |
value |
unit |
method |
value |
| 1 |
• | QC1DB |
MEDIAN |
3.74e+03 |
Angstrom |
OFF | ± 10 |
94 |
lambda_min |
this |
last_yr |
all
|
Minimum wavelength in A, from ARCLAMP data BLUE 437.0nm, 1x1, 0.4arcs slit |
| 2 |
• | QC1DB |
MEDIAN |
94 |
Angstrom |
OFF | ± 1 |
94 |
order_min_det |
this |
last_yr |
all
|
Minimum order number, same data |
| 3 |
• | QC1DB |
MEDIAN |
0 |
Angstrom |
VAL | -0.0001,0.0001 |
94 |
resid_avg |
this |
last_yr |
all
|
Average residual in A, same data |
| 4 |
• | QC1DB |
MEDIAN |
4.99e+03 |
Angstrom |
OFF | ± 20 |
94 |
lambda_max |
this |
last_yr |
all
|
Maximum wavelength in A, same data |
| 5 |
• | QC1DB |
MEDIAN |
124 |
Angstrom |
OFF | ± 1 |
94 |
order_max_det |
this |
last_yr |
all
|
Maximum order number, same data |
| 6 |
• | QC1DB |
MEDIAN |
0.47 |
milli-Angstrom |
VAL | 0.4,3 |
94 |
resid_rms |
this |
last_yr |
all
|
RMS of residuals in mA, same data |
| |
|
*Data sources: QC1DB: QC1 database; LOCAL: local data source
|
Plot 1
scores:  8| 8|
| | data source: | uves_wave
(QC1 database) |
| dataset: | lambda_min | • |
| median: | 3.74e+03 | Angstrom |
| rel. thresholds: | 3731.184...3751.184 | Angstrom |
| N_data plotted: | 94 |
| [click plot for closeup] |
Plot 2
scores: not implemented
| | data source: | uves_wave
(QC1 database) |
| dataset: | order_min_det | • |
| median: | 94 | Angstrom |
| rel. thresholds: | 93.0...95.0 | Angstrom |
| N_data plotted: | 94 |
| [click plot for closeup] |
Plot 3
scores: 8|
| | data source: | uves_wave
(QC1 database) |
| dataset: | resid_avg | • |
| median: | 0 | Angstrom |
| fixed thresholds: | -0.0001...0.0001 | Angstrom |
| N_data plotted: | 94 |
| [click plot for closeup] |
Plot 4
scores: not implemented
| | data source: | uves_wave
(QC1 database) |
| dataset: | lambda_max | • |
| median: | 4.99e+03 | Angstrom |
| rel. thresholds: | 4973.748...5013.748 | Angstrom |
| N_data plotted: | 94 |
| [click plot for closeup] |
Plot 5
scores: 8|
| | data source: | uves_wave
(QC1 database) |
| dataset: | order_max_det | • |
| median: | 124 | Angstrom |
| rel. thresholds: | 123.0...125.0 | Angstrom |
| N_data plotted: | 94 |
| [click plot for closeup] |
Plot 6
scores: 8|
| | data source: | uves_wave
(QC1 database) |
| dataset: | resid_rms | • |
| median: | 0.47 | milli-Angstrom |
| fixed thresholds: | 0.4...3 | milli-Angstrom |
| N_data plotted: | 94 |
| [click plot for closeup] |
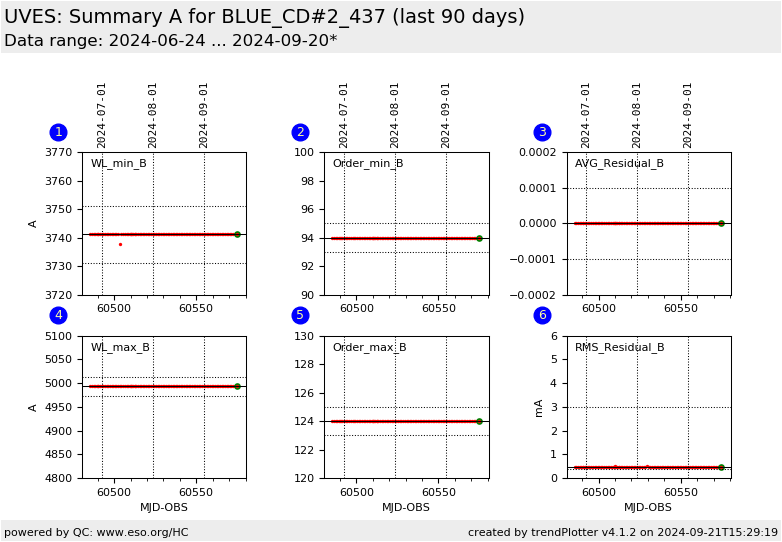
This is the trending report for the quality of the UVES Echelle wavelength
calibration. It is based on QC
parameters derived from WAVE_ECH frames.
This report presents the first (summary A) of two sets of detailed parameters. Data
are
for the BLUE 437, 1x1,
0.4 arcs setting.
The individual plots describe:
- the minimum wavelength of the solution. Changes of a few nm
usually occur because of changes in the last detected line, which
often happens when the position of the orders changes slightly (see
Grating Position trending).
Changes of tens-hundreds of nm are usually due to the pipeline failing
to locate entire orders.
- the minimum order found in the solution.
(The minimum order
is available in the QC1 database only since 2011-05-05.)
- The average of the residuals of the lines used in the final
solution with respect to their laboratory wavelengths.
- the maximum wavelength of the solution (see also remark for the minimum
wavelength)
- the maximum order found in the solution.
- the RMS of the residuals of the lines used in the final solution with
respect to their laboratory wavelengths.
Find more information about UVES wavelength solution monitoring here.
General information
Click on any of the plots to see a close-up version.
The latest date is indicated on top of the plot.
If configured,
- data points belonging to the latest date are specially marked
- statistical averages are indicated by a solid line, and thresholds by broken lines
- outliers are marked by a red asterisk. They are defined as data points outside the
threshold lines
- "aliens" (= data points outside the plot Y limits) are marked by a red arrow (↑ or ↓)
- you can download the data for each parameter set if the 'Data downloads' link shows up
|
