Plot
? |
Symb
? |
Source
* |
Average ? |
Thresholds ? |
N_
data |
QC1
parameter |
Data
downloads |
Remarks |
| method |
value |
unit |
method |
value |
| 1 |
• | QC1DB |
none |
|
ADU/s |
VAL | 70000,110000 |
5 |
efficiency |
this |
last_yr |
all
|
lamp and filter performance Q2, I filter |
| 2 |
• | QC1DB |
none |
|
ADU/s |
VAL | 70000,110000 |
5 |
efficiency |
this |
last_yr |
all
|
lamp and filter performance Q1, I filter |
| 3 |
• | QC1DB |
none |
|
ADU/s |
VAL | 60000,90000 |
1 |
efficiency |
this |
last_yr |
all
|
lamp and filter performance Q2, z filter |
| 4 |
• | QC1DB |
none |
|
ADU/s |
VAL | 60000,90000 |
1 |
efficiency |
this |
last_yr |
all
|
lamp and filter performance Q1, z filter |
| 5 |
• | QC1DB |
none |
|
ADU/s |
VAL | 70000,110000 |
5 |
efficiency |
this |
last_yr |
all
|
lamp and filter performance Q3, I filter |
| 6 |
• | QC1DB |
none |
|
ADU/s |
VAL | 70000,110000 |
5 |
efficiency |
this |
last_yr |
all
|
lamp and filter performance Q4, I filter |
| 7 |
• | QC1DB |
none |
|
ADU/s |
VAL | 60000,90000 |
1 |
efficiency |
this |
last_yr |
all
|
lamp and filter performance Q3, z filter |
| 8 |
• | QC1DB |
none |
|
ADU/s |
VAL | 60000,90000 |
1 |
efficiency |
this |
last_yr |
all
|
lamp and filter performance Q4, z filter |
| |
|
*Data sources: QC1DB: QC1 database; LOCAL: local data source
|
Plot 1
scores:  2| 2|
| | data source: | vimos_scrflat
(QC1 database) |
| dataset: | efficiency | • |
| average: | none |
| fixed thresholds: | 70000...110000 | ADU/s |
| N_data plotted: | 5 |
| [click plot for closeup] |
Plot 2
scores: 2|
| | data source: | vimos_scrflat
(QC1 database) |
| dataset: | efficiency | • |
| average: | none |
| fixed thresholds: | 70000...110000 | ADU/s |
| N_data plotted: | 5 |
| [click plot for closeup] |
Plot 3
scores: 1|
| | data source: | vimos_scrflat
(QC1 database) |
| dataset: | efficiency | • |
| average: | none |
| fixed thresholds: | 60000...90000 | ADU/s |
| N_data plotted: | 1 |
| [click plot for closeup] |
Plot 4
scores: 1|
| | data source: | vimos_scrflat
(QC1 database) |
| dataset: | efficiency | • |
| average: | none |
| fixed thresholds: | 60000...90000 | ADU/s |
| N_data plotted: | 1 |
| [click plot for closeup] |
Plot 5
scores: 2|
| | data source: | vimos_scrflat
(QC1 database) |
| dataset: | efficiency | • |
| average: | none |
| fixed thresholds: | 70000...110000 | ADU/s |
| N_data plotted: | 5 |
| [click plot for closeup] |
Plot 6
scores: 2|
| | data source: | vimos_scrflat
(QC1 database) |
| dataset: | efficiency | • |
| average: | none |
| fixed thresholds: | 70000...110000 | ADU/s |
| N_data plotted: | 5 |
| [click plot for closeup] |
Plot 7
scores: 1|
| | data source: | vimos_scrflat
(QC1 database) |
| dataset: | efficiency | • |
| average: | none |
| fixed thresholds: | 60000...90000 | ADU/s |
| N_data plotted: | 1 |
| [click plot for closeup] |
Plot 8
scores: 1|
| | data source: | vimos_scrflat
(QC1 database) |
| dataset: | efficiency | • |
| average: | none |
| fixed thresholds: | 60000...90000 | ADU/s |
| N_data plotted: | 1 |
| [click plot for closeup] |
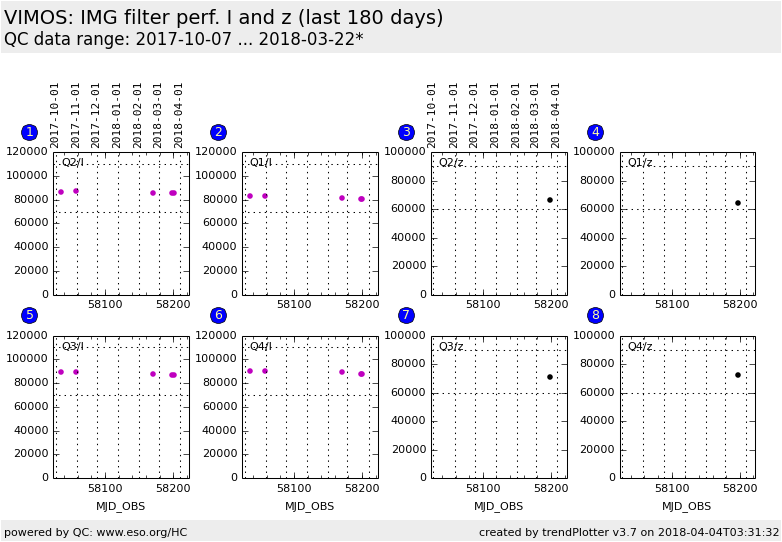
Trending plot for performance of IMG filters and flat field lamps.
There are two continuum lamps for VIMOS: QTH10 and QTH50. QTH10 is used
for screen flats with VRIz, QTH50 for screen flats with U and B.
Template ID: img_cal_ScreenFlat. Pipeline recipe: vmimflatscreen.
General information
Click on any of the plots to see a close-up version.
The latest date is indicated on top of the plot.
If configured,
- data points belonging to the latest date are specially marked
- statistical averages are indicated by a solid line, and thresholds by broken lines
- outliers are marked by a red asterisk. They are defined as data points outside the
threshold lines
- "aliens" (= data points outside the plot Y limits) are marked by a red arrow (↑ or ↓)
- you can download the data for each parameter set if the 'Data downloads' link shows up
|
