Plot
? |
Symb
? |
Source
* |
Average ? |
Thresholds ? |
N_
data |
QC1
parameter |
Data
downloads |
Remarks |
| method |
value |
unit |
method |
value |
| 1 |
• | QC1DB |
MEDIAN |
3.41e+06 |
ADU/s |
VAL | 2.5E6,4.5E6 |
150 |
flux |
this |
last_yr |
all
|
Q2, flux from IFU flats |
| 2 |
• | QC1DB |
MEDIAN |
5.25e+06 |
ADU/s |
VAL | 3.5E6,6.0E6 |
150 |
flux |
this |
last_yr |
all
|
Q1, flux from IFU flats |
| 3 |
• | QC1DB |
MEDIAN |
4.16e+06 |
ADU/s |
VAL | 2.5E6,5.0E6 |
150 |
flux |
this |
last_yr |
all
|
Q3, flux from IFU flats |
| 4 |
• | QC1DB |
MEDIAN |
5.45e+06 |
ADU/s |
VAL | 4.0E6,6.5E6 |
150 |
flux |
this |
last_yr |
all
|
Q4, flux from IFU flats |
| |
|
*Data sources: QC1DB: QC1 database; LOCAL: local data source
|
Plot 1
scores: not implemented
| | data source: | vimos_ifu_score
(QC1 database) |
| dataset: | flux | • |
| median: | 3.41e+06 | ADU/s |
| fixed thresholds: | 2500000.0...4500000.0 | ADU/s |
| N_data plotted: | 150 |
| [click plot for closeup] |
Plot 2
scores: not implemented
| | data source: | vimos_ifu_score
(QC1 database) |
| dataset: | flux | • |
| median: | 5.25e+06 | ADU/s |
| fixed thresholds: | 3500000.0...6000000.0 | ADU/s |
| N_data plotted: | 150 |
| [click plot for closeup] |
Plot 3
scores: not implemented
| | data source: | vimos_ifu_score
(QC1 database) |
| dataset: | flux | • |
| median: | 4.16e+06 | ADU/s |
| fixed thresholds: | 2500000.0...5000000.0 | ADU/s |
| N_data plotted: | 150 |
| [click plot for closeup] |
Plot 4
scores: not implemented
| | data source: | vimos_ifu_score
(QC1 database) |
| dataset: | flux | • |
| median: | 5.45e+06 | ADU/s |
| fixed thresholds: | 4000000.0...6500000.0 | ADU/s |
| N_data plotted: | 150 |
| [click plot for closeup] |
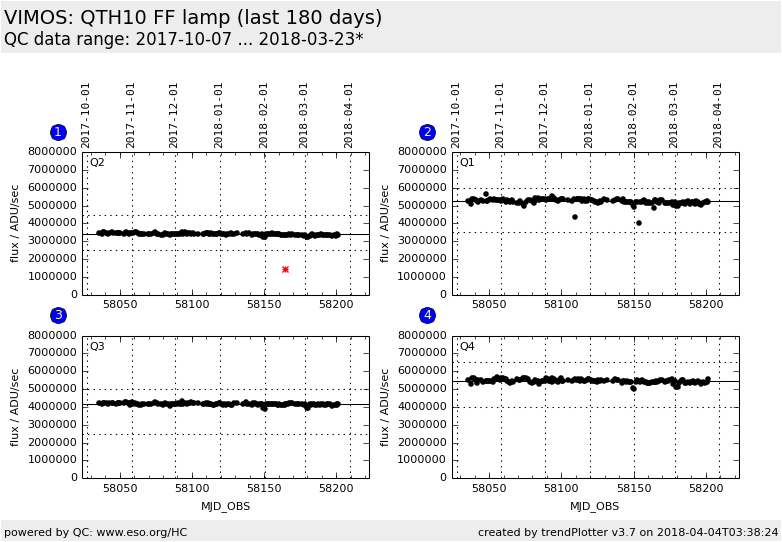
Trending plot for the QTH10 FF lamp.
The lamp performance is measured using IFU spectroscopic flats
using the LR_red grism and the IFU shutter.
The values should show smooth trending without sudden jumps.
There are occasional pipeline failures in quadrant 2 that cause an
artificially low value for the extracted flux. These are not due
to instrument problems.
Template ID: ifu_cal_DayCalib: Pipeline recipe: vmifucalib.
General information
Click on any of the plots to see a close-up version.
The latest date is indicated on top of the plot.
If configured,
- data points belonging to the latest date are specially marked
- statistical averages are indicated by a solid line, and thresholds by broken lines
- outliers are marked by a red asterisk. They are defined as data points outside the
threshold lines
- "aliens" (= data points outside the plot Y limits) are marked by a red arrow (↑ or ↓)
- you can download the data for each parameter set if the 'Data downloads' link shows up
|
