Plot
? |
Symb
? |
Source
* |
Average ? |
Thresholds ? |
N_
data |
QC1
parameter |
Data
downloads |
Remarks |
| method |
value |
unit |
method |
value |
| 1 |
• | QC1DB |
MEDIAN |
0.00585 |
pix/mm |
VAL | -0.002,0.008 |
87 |
xy |
this |
last_yr |
all
|
coefficient a(xy), Q2 |
| 2 |
• | QC1DB |
MEDIAN |
0.00365 |
pix/mm |
VAL | -0.005,0.005 |
85 |
xy |
this |
last_yr |
all
|
coefficient a(xy), Q1 |
| 3 |
• | QC1DB |
MEDIAN |
-0.00621 |
pix/mm |
VAL | -0.008,0.002 |
87 |
yx |
this |
last_yr |
all
|
coefficient a(yx), Q2 |
| 4 |
• | QC1DB |
MEDIAN |
-0.00285 |
pix/mm |
VAL | -0.005,0.005 |
85 |
yx |
this |
last_yr |
all
|
coefficient a(yx), Q1 |
| 5 |
• | QC1DB |
MEDIAN |
-0.00123 |
pix/mm |
VAL | -0.006,0.004 |
87 |
xy |
this |
last_yr |
all
|
coefficient a(xy), Q3 |
| 6 |
• | QC1DB |
MEDIAN |
0.00202 |
pix/mm |
VAL | 0.0,0.010 |
85 |
xy |
this |
last_yr |
all
|
coefficient a(xy), Q4 |
| 7 |
• | QC1DB |
MEDIAN |
0.000909 |
pix/mm |
VAL | -0.004,0.006 |
87 |
yx |
this |
last_yr |
all
|
coefficient a(yx), Q3 |
| 8 |
• | QC1DB |
MEDIAN |
-0.00219 |
pix/mm |
VAL | -0.010,0.0 |
85 |
yx |
this |
last_yr |
all
|
coefficient a(yx), Q4 |
| |
|
*Data sources: QC1DB: QC1 database; LOCAL: local data source
|
Plot 1
scores:  7| 7|
| | data source: | vimos_mask2ccd
(QC1 database) |
| dataset: | xy | • |
| median: | 0.00585 | pix/mm |
| fixed thresholds: | -0.002...0.008 | pix/mm |
| N_data plotted: | 87 |
| [click plot for closeup] |
Plot 2
scores: 7|
| | data source: | vimos_mask2ccd
(QC1 database) |
| dataset: | xy | • |
| median: | 0.00365 | pix/mm |
| fixed thresholds: | -0.005...0.005 | pix/mm |
| N_data plotted: | 85 |
| [click plot for closeup] |
Plot 3
scores: 7|
| | data source: | vimos_mask2ccd
(QC1 database) |
| dataset: | yx | • |
| median: | -0.00621 | pix/mm |
| fixed thresholds: | -0.008...0.002 | pix/mm |
| N_data plotted: | 87 |
| [click plot for closeup] |
Plot 4
scores: 7|
| | data source: | vimos_mask2ccd
(QC1 database) |
| dataset: | yx | • |
| median: | -0.00285 | pix/mm |
| fixed thresholds: | -0.005...0.005 | pix/mm |
| N_data plotted: | 85 |
| [click plot for closeup] |
Plot 5
scores: 7|
| | data source: | vimos_mask2ccd
(QC1 database) |
| dataset: | xy | • |
| median: | -0.00123 | pix/mm |
| fixed thresholds: | -0.006...0.004 | pix/mm |
| N_data plotted: | 87 |
| [click plot for closeup] |
Plot 6
scores: 7|
| | data source: | vimos_mask2ccd
(QC1 database) |
| dataset: | xy | • |
| median: | 0.00202 | pix/mm |
| fixed thresholds: | 0.0...0.01 | pix/mm |
| N_data plotted: | 85 |
| [click plot for closeup] |
Plot 7
scores: 7|
| | data source: | vimos_mask2ccd
(QC1 database) |
| dataset: | yx | • |
| median: | 0.000909 | pix/mm |
| fixed thresholds: | -0.004...0.006 | pix/mm |
| N_data plotted: | 87 |
| [click plot for closeup] |
Plot 8
scores: 7|
| | data source: | vimos_mask2ccd
(QC1 database) |
| dataset: | yx | • |
| median: | -0.00219 | pix/mm |
| fixed thresholds: | -0.01...0.0 | pix/mm |
| N_data plotted: | 85 |
| [click plot for closeup] |
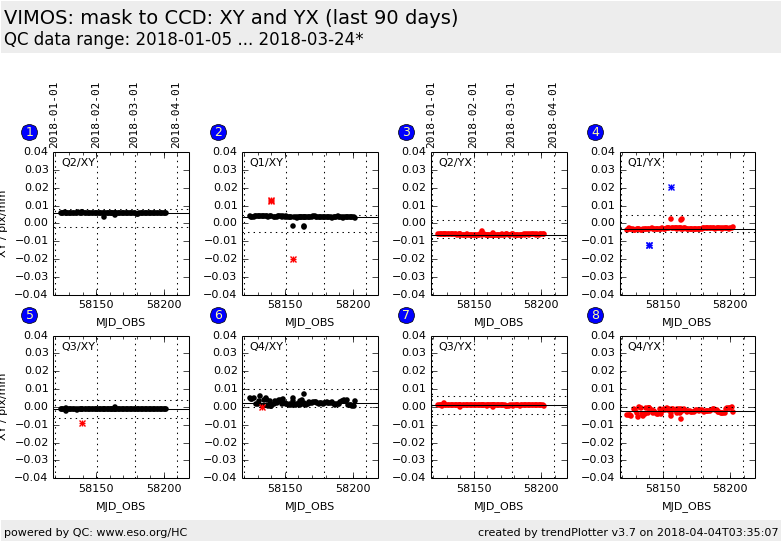
Trending plots for monitoring the coefficients of the mask to CCD transformation.
The transformation is as follows:
X = a(xx)*x + a(xy)*y + x(0)
Y = a(yx)*x + a(yy)*y + y(0)
with (x,y) being mask coordinates in mm and (X,Y) CCD coordinates in pixel.
X direction is along the slit orientation, y direction is perpendicular to
the slits (i.e. in dispersion direction).
These trending plots show the time
evolution of the matrix coefficients a(xx), a(xy), a(yx), and a(yy). The
diagonal coefficients a(xx) and a(yy) give the scale factor between mask and
CCD (near 8.4 pixel/mm). Variations are mainly cause by temperature changes,
the empirical tolerance is around +/- 0.006 pixel/mm.
The coefficients a(xy) and a(yx) give the rotation and should be near zero.
The tolerance is +/- 0.005 pixel/mm around the empirical average.
The procedure in case of violation of the thresholds is described on the
SciOps Wiki pages.
Template ID: img_tec_MaskToCcd. Pipeline recipe: vmmasktoccd.
General information
Click on any of the plots to see a close-up version.
The latest date is indicated on top of the plot.
If configured,
- data points belonging to the latest date are specially marked
- statistical averages are indicated by a solid line, and thresholds by broken lines
- outliers are marked by a red asterisk. They are defined as data points outside the
threshold lines
- "aliens" (= data points outside the plot Y limits) are marked by a red arrow (↑ or ↓)
- you can download the data for each parameter set if the 'Data downloads' link shows up
|
