Plot
? |
Symb
? |
Source
* |
Average ? |
Thresholds ? |
N_
data |
QC1
parameter |
Data
downloads |
Remarks |
| method |
value |
unit |
method |
value |
| 1 |
• | QC1DB |
MEAN |
-4.23 |
pix |
VAL | -10,10 |
12 |
trace2_slope |
this |
last_yr |
all
|
Q2, IFU slope x 4096 |
| 2 |
• | QC1DB |
MEAN |
0.343 |
pix |
VAL | -10,10 |
12 |
trace2_slope |
this |
last_yr |
all
|
Q1, IFU slope x 4096 |
| 3 |
• | QC1DB |
MEAN |
-6.72 |
pix |
VAL | -10,10 |
12 |
trace2_slope |
this |
last_yr |
all
|
Q3, IFU slope x 4096 |
| 4 |
• | QC1DB |
MEAN |
-0.758 |
pix |
VAL | -10,10 |
12 |
trace2_slope |
this |
last_yr |
all
|
Q4, IFU slope x 4096 |
| |
|
*Data sources: QC1DB: QC1 database; LOCAL: local data source
|
Plot 1
scores:  1| 1|
| | data source: | vimos_ifu_score
(QC1 database) |
| dataset: | trace2_slope | • |
| mean: | -4.23 | pix |
| fixed thresholds: | -10...10 | pix |
| N_data plotted: | 12 |
| [click plot for closeup] |
Plot 2
scores: 1|
| | data source: | vimos_ifu_score
(QC1 database) |
| dataset: | trace2_slope | • |
| mean: | 0.343 | pix |
| fixed thresholds: | -10...10 | pix |
| N_data plotted: | 12 |
| [click plot for closeup] |
Plot 3
scores: 1|
| | data source: | vimos_ifu_score
(QC1 database) |
| dataset: | trace2_slope | • |
| mean: | -6.72 | pix |
| fixed thresholds: | -10...10 | pix |
| N_data plotted: | 12 |
| [click plot for closeup] |
Plot 4
scores: 1|
| | data source: | vimos_ifu_score
(QC1 database) |
| dataset: | trace2_slope | • |
| mean: | -0.758 | pix |
| fixed thresholds: | -10...10 | pix |
| N_data plotted: | 12 |
| [click plot for closeup] |
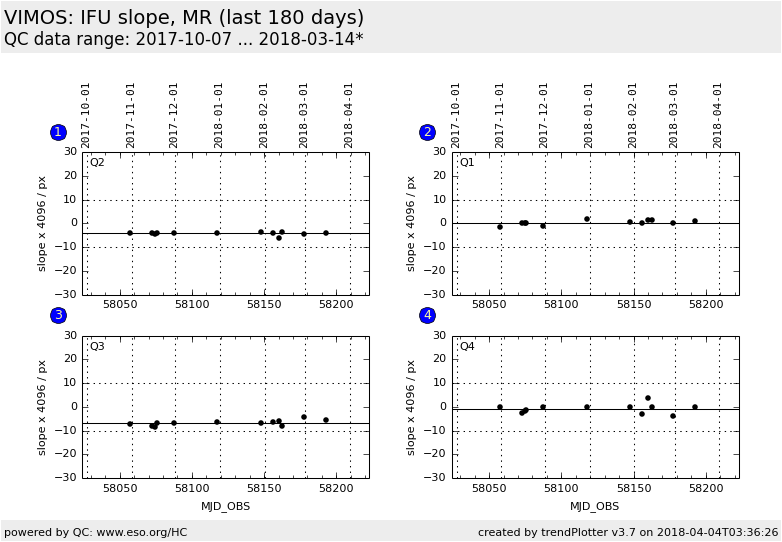
Trending plot for slope of fibre traces (IFU).
The QC1 parameter QC.IFU.TRACE2.SLOPE is multiplied with 4096 (the Y dimension of the CCD).
The result should stay within +/- 10 pixels around zero.
Setting HR_orange is usually measured daily; other settings only when science
frames have been observed.
Template ID: ifu_cal_DayCalib (daytime Health Checks), ifu_cal_NightCalib
(attached night-time). Pipeline recipe: vmifucalib.
General information
Click on any of the plots to see a close-up version.
The latest date is indicated on top of the plot.
If configured,
- data points belonging to the latest date are specially marked
- statistical averages are indicated by a solid line, and thresholds by broken lines
- outliers are marked by a red asterisk. They are defined as data points outside the
threshold lines
- "aliens" (= data points outside the plot Y limits) are marked by a red arrow (↑ or ↓)
- you can download the data for each parameter set if the 'Data downloads' link shows up
|
