Sorry! This page is not yet available in your preferred language, so we're displaying the original version instead.
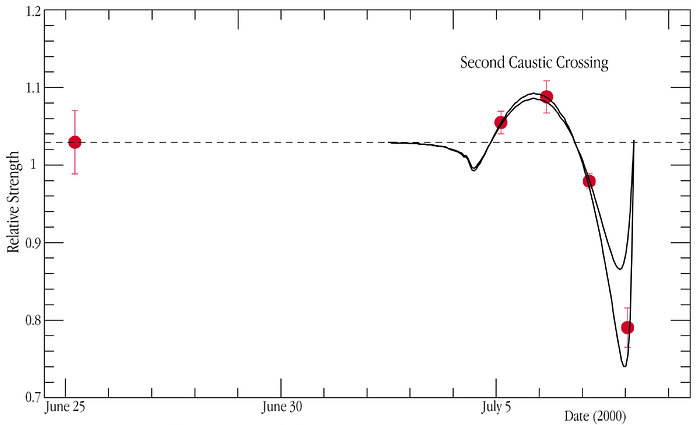
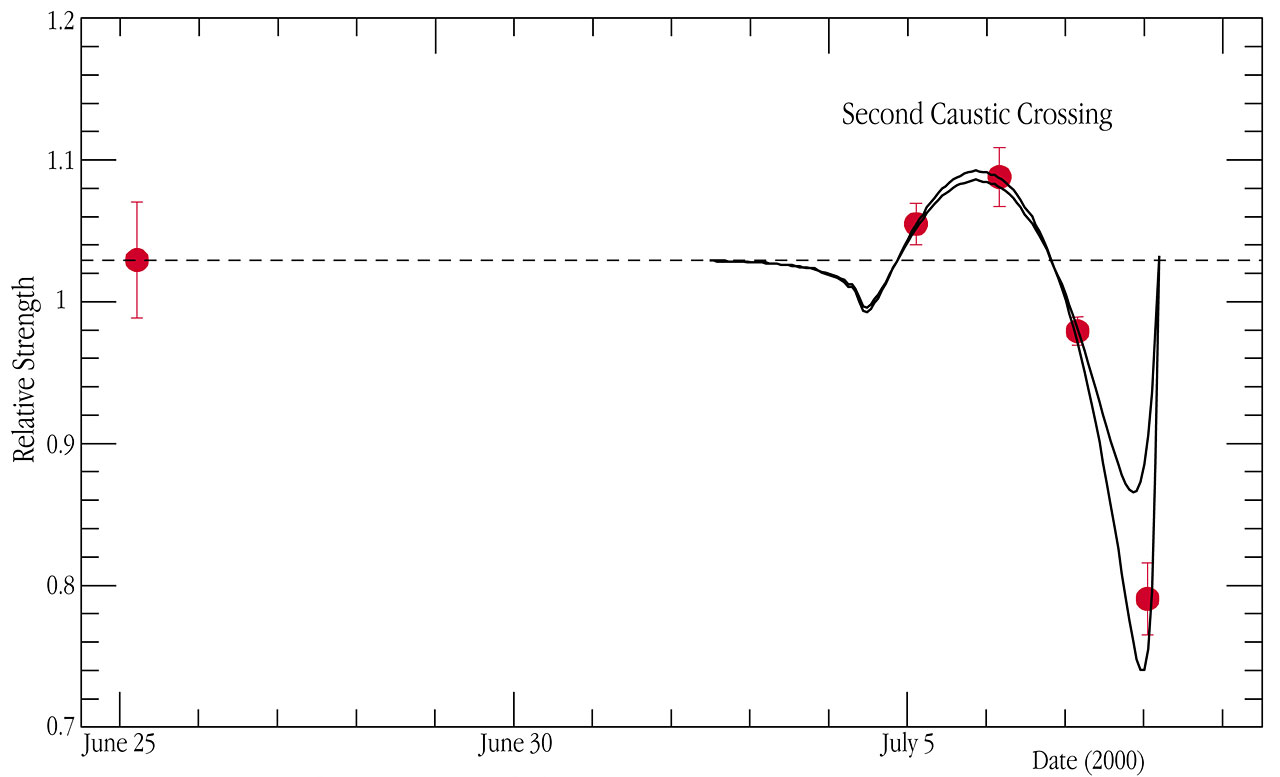
H-alpha line strength of EROS-BLG-2000-5
The red points in the chart are the nightly averages of the strength of the H-alpha absorption line as measured before (point to the left) and during the second caustic crossing. The fully drawn lines represent the expected change, according to two different simulations of the event. The models agree with the data in their general form, but differ on the last night when the trailing limb was crossing the caustic. The two simulations shown differ in their assumptions about the geometry of the event; further data and modeling are now refining these assumptions so that a more quantitative comparison can be made.
Crédit:ESO
À propos de l'image
| Identification: | eso0117d |
| Type: | Graphique |
| Date de publication: | 25 avril 2001 |
| Communiqués de presse en rapport: | eso0117 |
| Taille: | 3000 x 1821 px |
À propos de l'objet
| Nom: | EROS-BLG-2000-5 |
| Type: | Milky Way : Star Milky Way : Cosmology : Phenomenon : Lensing |
| Distance: | 25000 années lumière |
| Catégorie: | Stars |